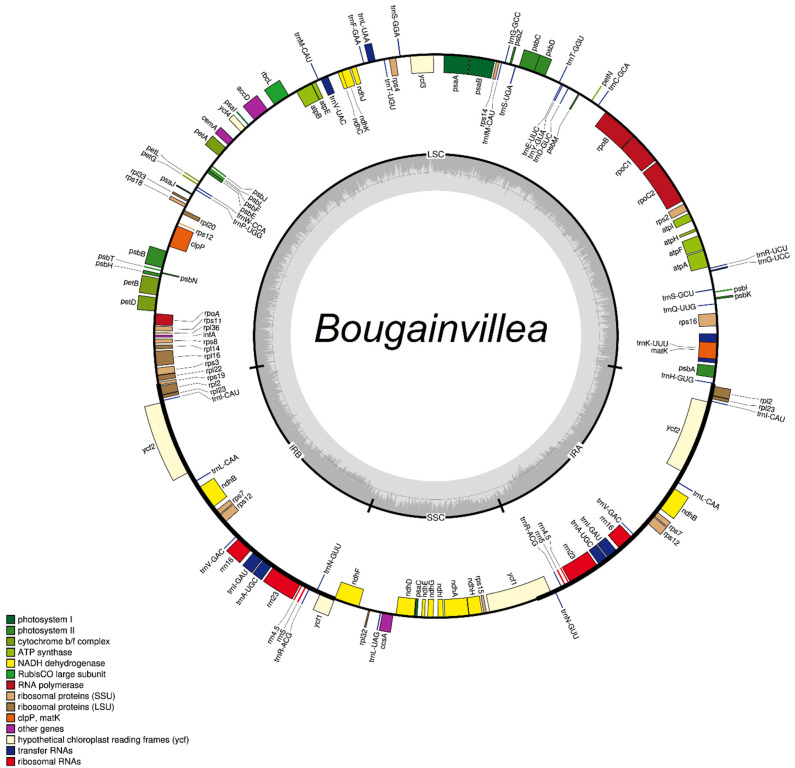
Figure 1.
General circular gene map of Bougainvillea chloroplast genomes showing the large single-copy (LSC) region, small single-copy (SSC) region, and inverted repeat regions (IRA, IRB). Genes within the circle were also color-coded according to their functional group. The dark gray and light gray plots correspond to the GC and AT contents, respectively.

