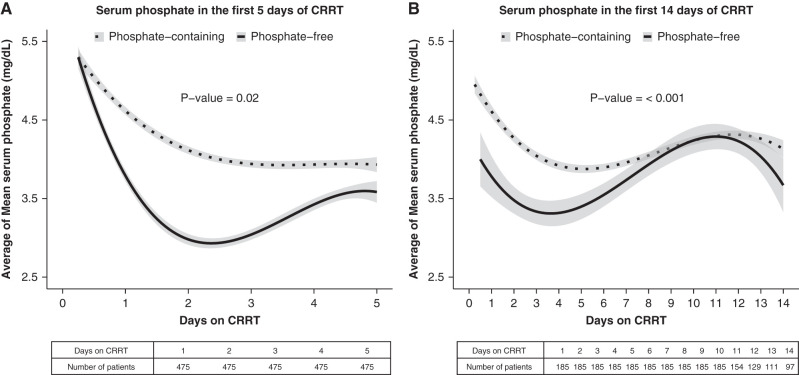
Figure 2.
Serum phosphate trajectory over 5 and 14 days of therapy. Unadjusted natural cubic splines of serum phosphate trajectories generated by averaging each patient’s 6-hour mean of measurements. (A) Represents the first 5 days of CRRT and (B) represents the first 14 days of CRRT in the whole cohort. The trajectories of serum phosphate levels of the two CRRT solution types were evaluated individually by autoregressive integrated moving average (ARIMA). The P value denotes the F test comparison of ARIMA model parameters between the two groups. The shaded area on either side of the line denotes 95% confidence intervals.

