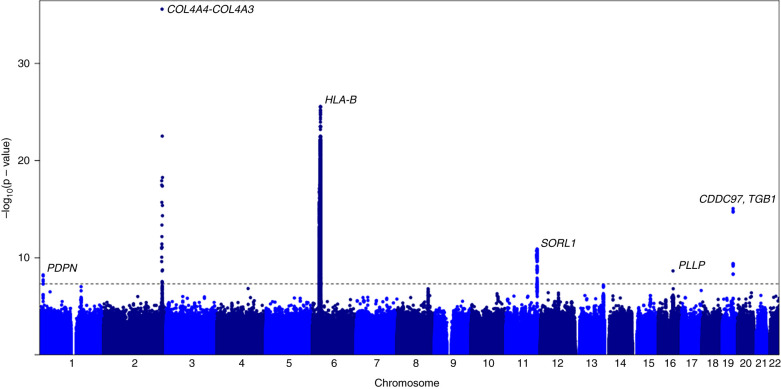
Figure 1.
Manhattan plot of associated signals in hematuria using centrally Haplotype Reference Consortium (HRC)–imputed UK Biobank data. Six statistically significant loci were identified. The x axis is the chromosome location from chromosome 1 to 22, and the y axis is the –log10(P value). The horizontal gray dashed line represents the threshold for statistical significance at P<0.001. The figure was generated using summary statistics from https://pheweb.org/UKB-SAIGE/pheno/593 in R version 4.0.5.

