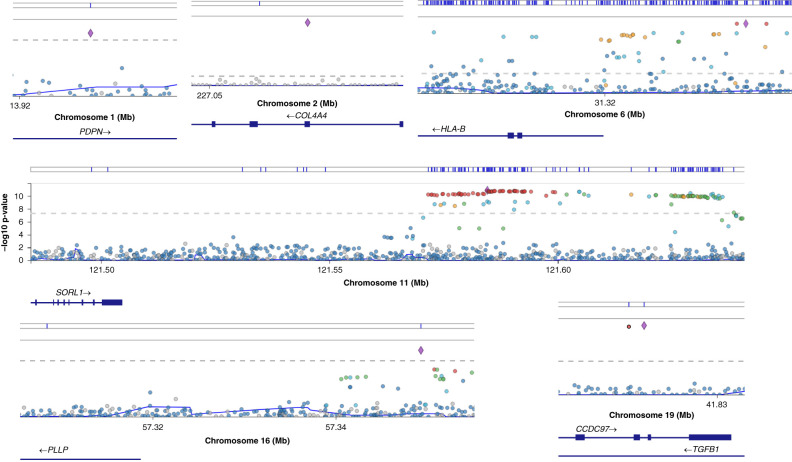
Figure 2.
LocusZoom plot at six loci showing associated hematuria variants using centrally HRC-imputed UK Biobank data (and Trans-Omics for Precision Medicine Program–imputed data at chromosome 2). The following genes were closest to the strongest associated variants at these loci: PDPN, COL4A4, HLA-B, SORL1, PLLP, and TGFB1. PDPN, SORL1, and PLLP are novel associations. This potentially highlights immune regulation (HLA-B) and podocytes in mediating hematuria. The x axis is the chromosome location, and the y axis is the –log10(P value). The horizontal gray dashed lines represent the threshold for statistical significance at P<0.001. Blue lines above the plots denote locations of variants present in the European Bioinformatics Institute–National Human Genome Research Institute genome-wide association studies catalog. The figure was generated using summary statistics from https://pheweb.org/UKB-SAIGE/pheno/593.

