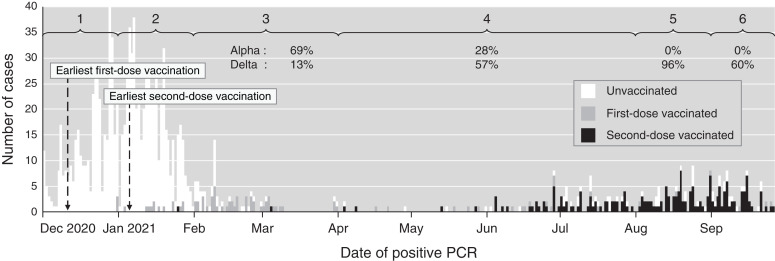
Figure 2.
Epidemic time course showing the number of new SARS-CoV-2 infections by date and vaccination status. Months with fewer cases were amalgamated to make six time periods (shown at the top). The community proportions of Alpha and Delta variants (dominant during the study) are provided for time periods with adequate data as percentages (not known in periods 1 and 2).

