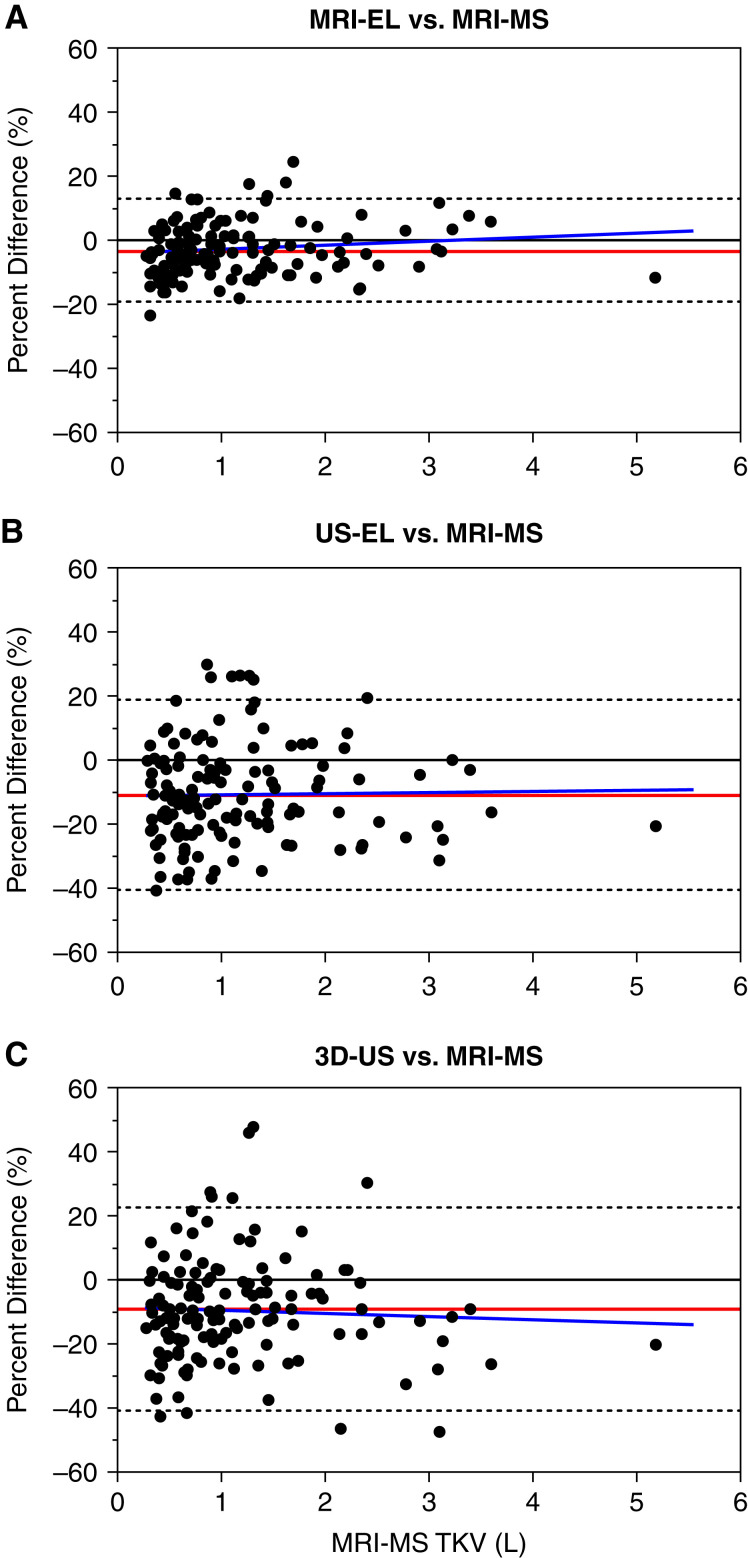
Figure 3.
Bland–Altman plots showing within-patient differences of total kidney volume (TKV) by (A) MRI-EL, (B) US-EL, and (C) 3D-US in comparison with MRI-MS (reference standard). The red line represents the mean percentage difference (bias). The gray dotted lines are the 95% limits of agreement. The blue line is the slope of the bias.

