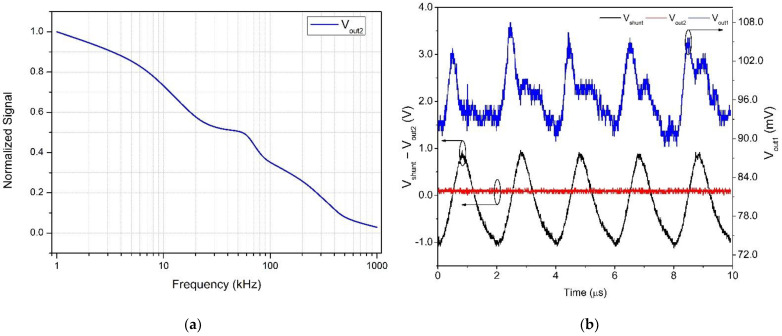
Figure 9.
System response of the sensor for an input sinusoidal waveform at different frequencies. (a) Frequency response curve, demonstrating the circuit’s capability of responding to frequencies close to 1 MHz. (b) Black trace: a 500 kHz sinusoidal input current, measured on a 10 Ω shunt resistor. Blue trace: response of the system to a 500 kHz input (Vout1, Figure 1a). Red trace: RMS equivalent of the input current (Vout2) (Black circles around curves indicate the applicable vertical axis).

