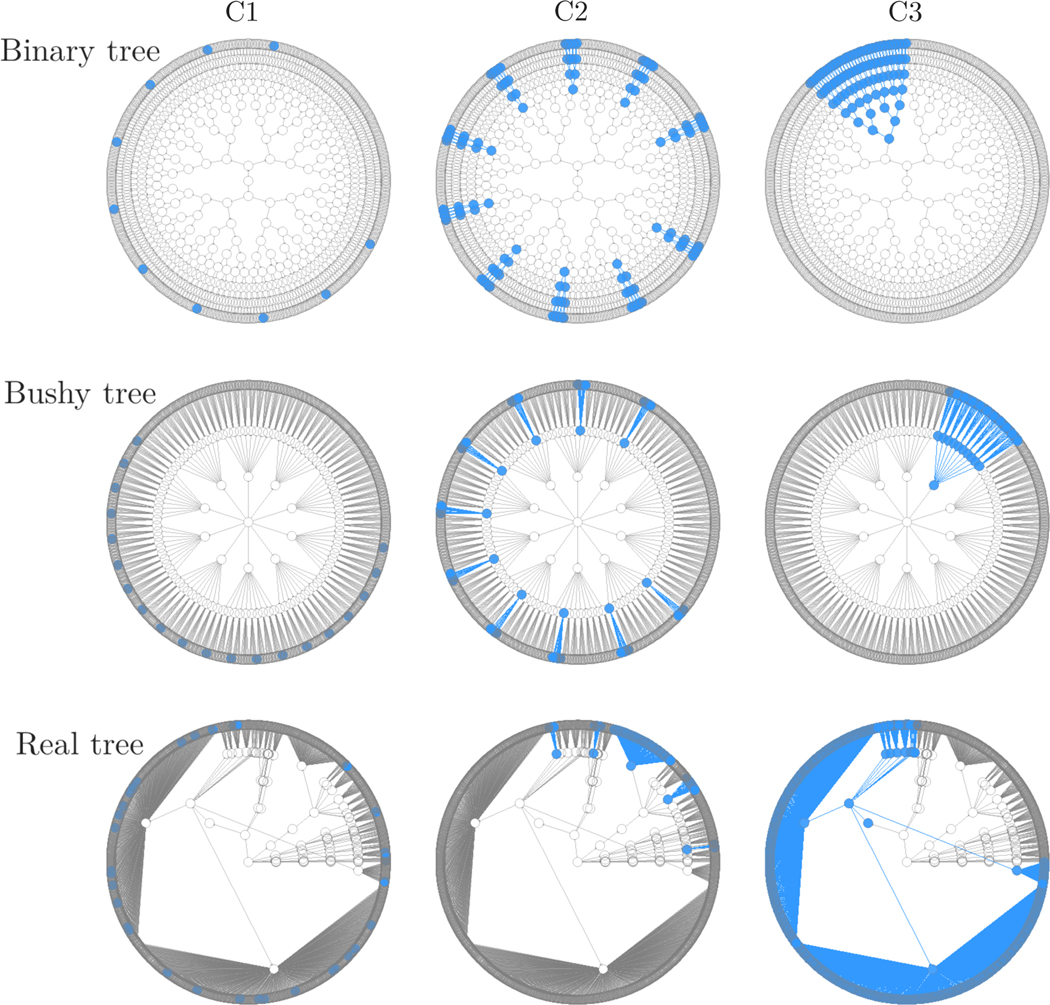
Figure 2:
The three tree structures (binary, bushy, and real) and three causal patterns (C1, C2, and C3) for simulation studies. The real phylogenetic tree structure was obtained from the IBD data and, for simplicity of exposition, skipped the genus and species levels which have extensive missing assignments. The root node is always located at the center of each tree and the leaf nodes are represented by the outermost ring. The top of each blue subtree is a designated driver node, which can be an inner or leaf node.

