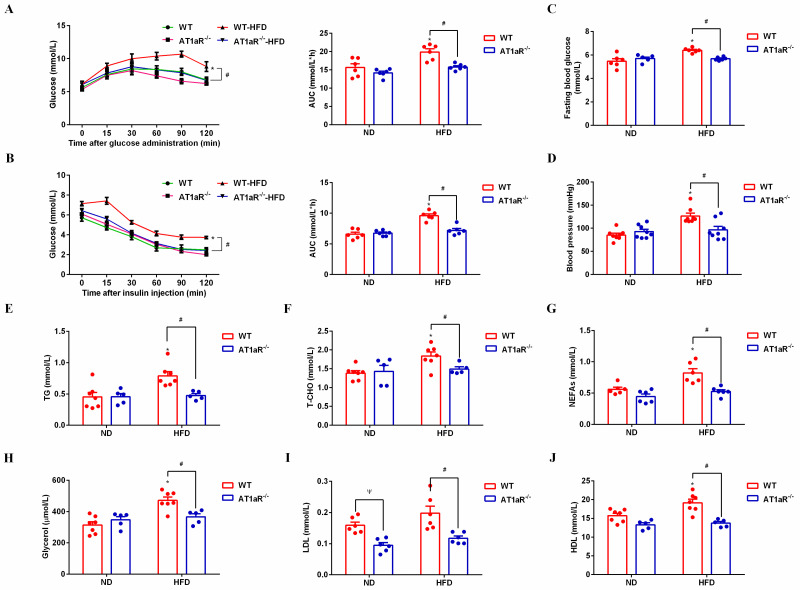
Fig 1. AT1aR knockout improved insulin resistance and metabolic disorders in high-fat diet rats.
A: Oral glucose tolerance test (OGTT) curve and area under the curve. B: Insulin tolerance test (ITT) curve and area under the curve. C: Fasting blood glucose (FBG). D: Blood pressure. E: Serum triglyceride (TG) levels. F: Serum total cholesterol (T-CHO). G: Serum free fatty acids (NEFAs). H: Serum glycerol. I: Serum low-density lipoprotein (LDL). J: Serum high-density lipoprotein (HDL). *p < 0.05 vs WT-ND rats; #p < 0.05 vs WT-HFD rats. Data were presented as Mean ± S.E.M. n = 6.

