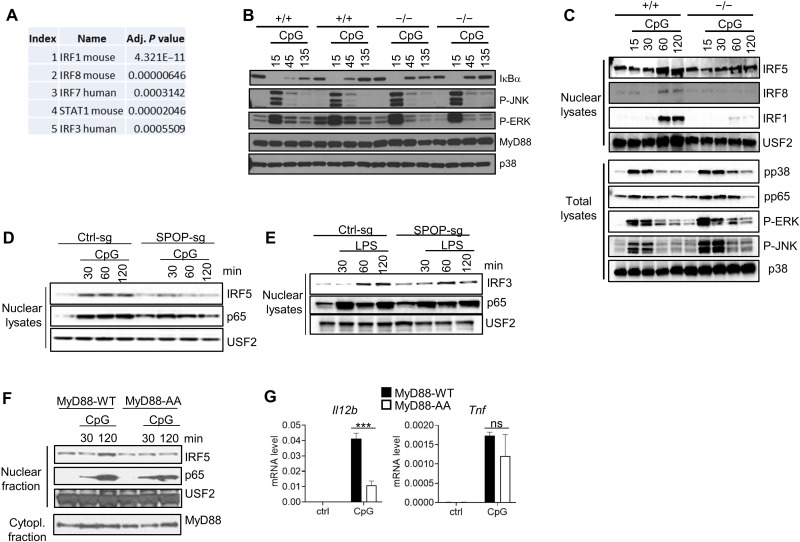
Fig. 3. SPOP controls TLR-induced IRF nuclear translocation and gene activation.
(A) RNA-seq/Enrichr/TTrust-based analysis of top 100 differentially regulated genes in CpG-DNA–induced wt and Spop−/− BMDC. The five top-scoring transcription factors are shown. (B) IB analysis of total lysates of BM-derived macrophages (BMMs) obtained from SPOP+/+ or SPOP−/− fetal liver chimeric mice. BMMs from two independent mice per genotype are shown. (C) IB analysis of nuclear extracts and total lysates from SPOP+/+ or SPOP−/− DCs derived from multipotent progenitor cells and stimulated with CpG-DNA. (D) IB analysis of nuclear extracts from Ctrl-sg or SPOP-sg RAW264.7 cells stimulated with CpG-DNA. (E) IB analysis of nuclear extracts from Ctrl-sg or SPOP-sg RAW264.7 cells stimulated with LPS. (F) IB analysis of nuclear and cytoplasmic fractions from CpG-DNA–stimulated macrophages derived from MyD88−/− multipotent progenitor cells that were reconstituted with wt or mutant MyD88 [MyD88-AA (SS136/137AA)]. (G) qPCR analysis of cells described in (F). Data represent mean ± SD from three independent experiments. ***P < 0.005 is determined by two-way ANOVA with Sidak’s multiple comparison test (B).

