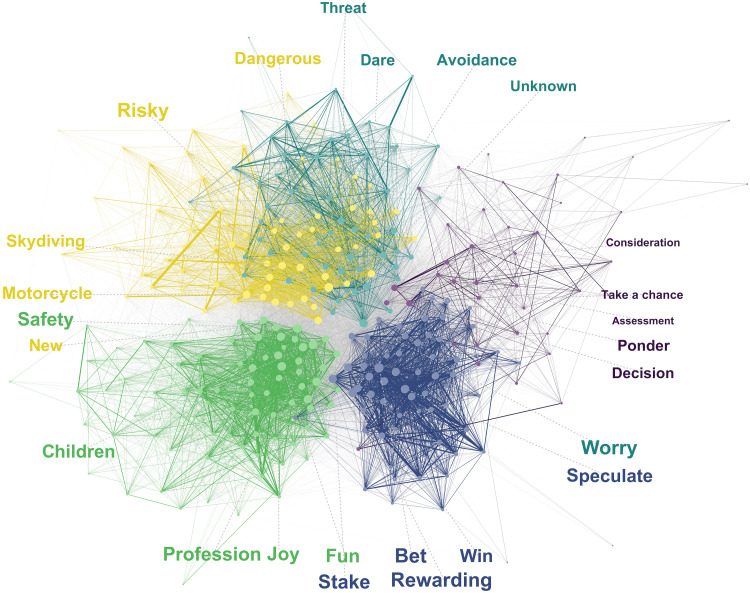
Fig. 3. The semantic network of risk.
Nodes represent the 307 distinct level 1 associates sized according to their importance for the network (PageRank). Edges represent the relatedness between nodes sized by the magnitude of the Jaccard index. Colors represent the five components identified by the Louvain algorithm (31). For each component, the five most important words are shown sized by importance. Gray lines in the background represent between-component edges. The layout of the nodes was determined using the Fruchterman-Reingold algorithm (58) including a minor edge weight bias for within-component edges to increase visual separation of the components.

