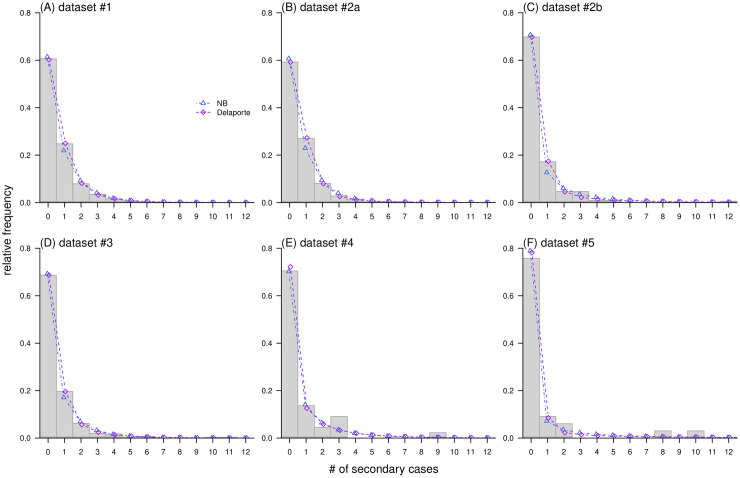
Fig 5. Fitting results of offspring distributions using the medians of posterior distributions for model parameters.
In each panel, probability mass functions (PMF) of negative binomial (NB, in blue), and Delaporte (in purple) distributions are shown in dots and lines, and the observations of number of secondary cases per infector (in grey) are in histogram. Note: The PMFs of NB and Delaporte distributions were shifted horizontally in each panel with slight jitters at −0.05 and +0.05, respectively to aid visualization and comparison.

