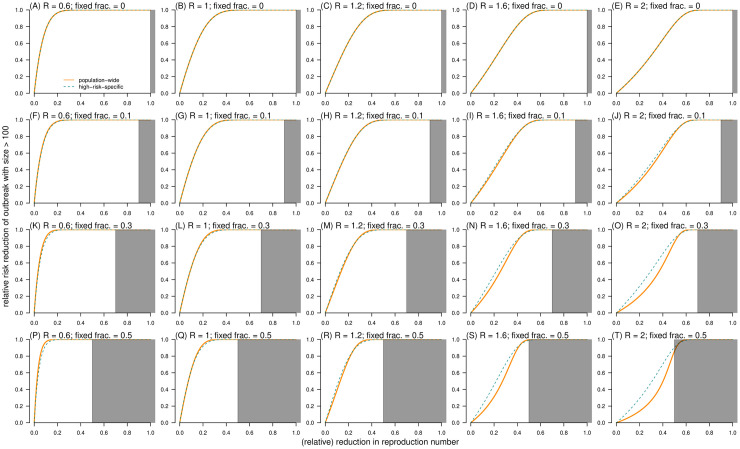
Fig 9. The relative risk reduction (RRR) of outcome (II): Having outbreak with final size c > 100 as a function of the relative reduction in reproduction number (ξ).
The RRR of control scheme (I) RRR(1)(ξ) is dashed cyan curve, and the RRR of control scheme (II) RRR(2)(ξ) is bold orange curve. In each panel, the dispersion parameter k is fixed at 0.2, and the shading region indicates the situation that ξ ≥ 1 − ρ. In each panel label, ‘R’ is the reproduction number, and ‘fixed frac.’ is the fraction of fixed component (ρ).

