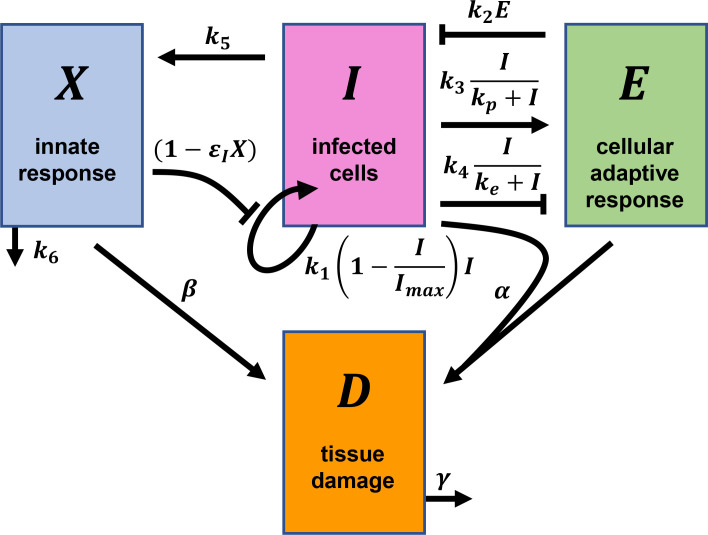
Fig 1. Schematic of the mathematical model of within-host SARS-CoV-2 infection.
The key quantities and their interactions contained in our model (Eqs 1–4) are illustrated. Arrows and blunt-head arrows depict positive and negative regulation, respectively. The parameters and rate expressions shown next to the arrows are described in the text.

