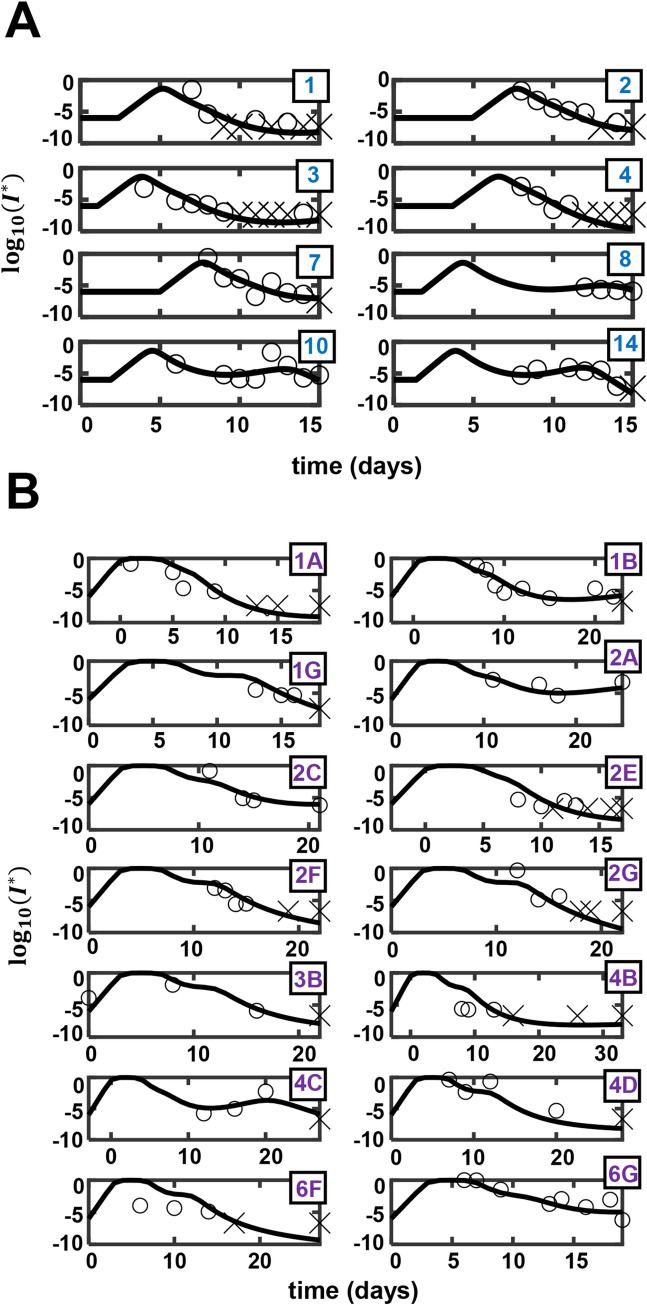
Fig 5. Fits of the model to viral load data from patients with mild and severe symptoms.
Best-fits of our model (lines) to data (symbols) of nasopharyngeal viral load from patients with (A) mild and (B) severe symptoms. Cross marks represent data points below the limit of detection. Entries in the boxes show patient IDs as provided in [38] in (A) and the location (row and column) of the subplot in the original figure in [60] from which the data was extracted in (B).

