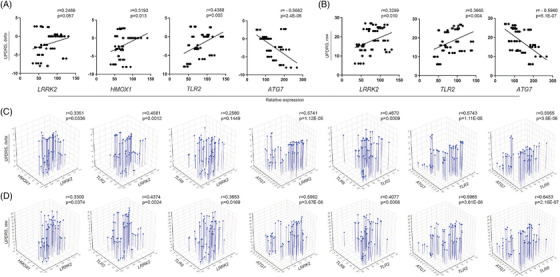
FIGURE 4.

Prediction of UPDRS III score by gene expression of potential biomarkers. (A) Correlation between genetic expression of LRRK2, HMOX1, TLR2, and ATG7 and change in UPDRS III score. (B) Correlation between genetic expression of LRRK2, TLR2, and ATG7 and raw UPDRS III score. (C) Multiple linear regression analysis of effect of genetic expression of LRRK2, HMOX1, TLR2, TLR8, and ATG7 on change in UPDRS III score. (D) Multiple linear regression analysis of effect of genetic expression of LRRK2, HMOX1, TLR2, TLR8, and ATG7 on raw UPDRS III score. (A,B) r = Pearson product‐moment correlation coefficient. (C,D) r = regression coefficient. p ≤ 0.05 was considered significant
