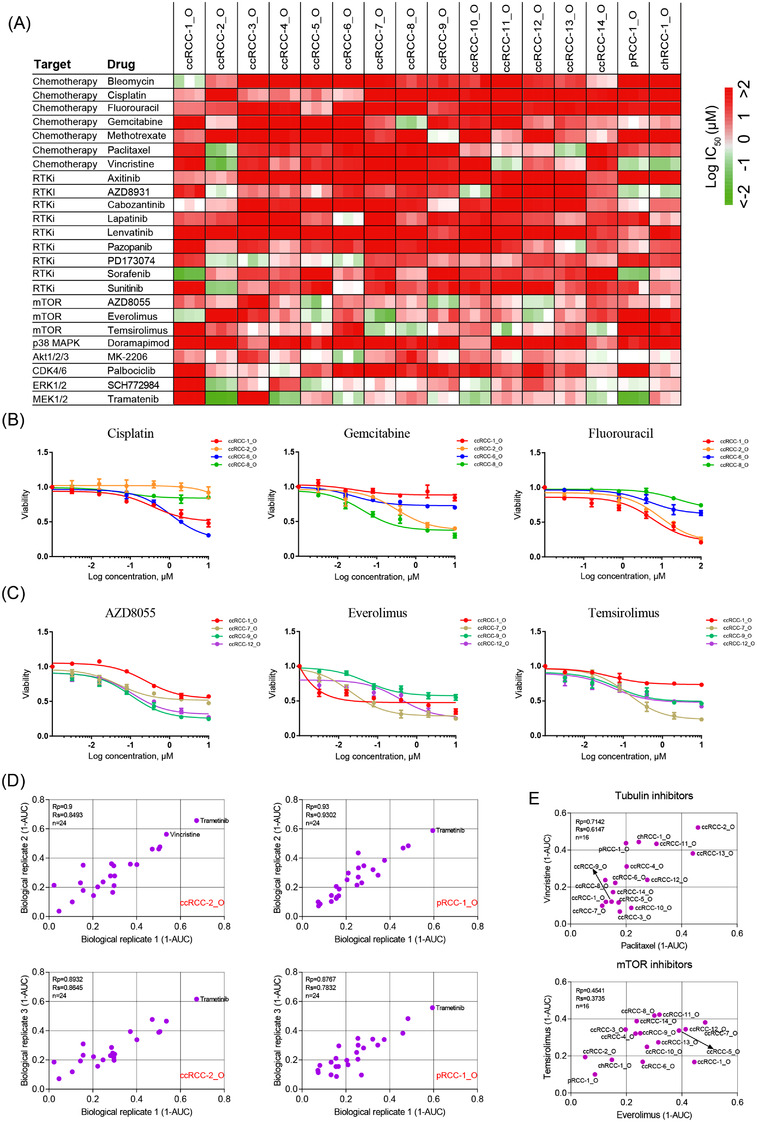
FIGURE 6.

Drug screening in patient‐derived renal cell carcinoma (RCC) organoids: (A) heat map of logIC50 values for 24 compounds tested on 16 RCC organoid lines; (B and C) dose–response curves for RCC organoids treated with the indicated chemotherapy drugs (B) and mTOR inhibitors (C). Each data point represents the mean of three biological replicates (organoids from different passages), with error bars representing ± standard error of the mean (SEM); (D) representative scatterplots of 1‐AUC (area under the curve) values for two biological replicates of the drug screening data, highlighting drugs (red) having an obvious inhibitory effect on viability (1‐AUC > .5 for both biological replicates) of indicated organoid lines; (E) representative scatterplots of 1‐AUC from drug screening data of paired drugs with the same nominal targets. Each data point represents three biological replicates, with error bars representing ± SEM
