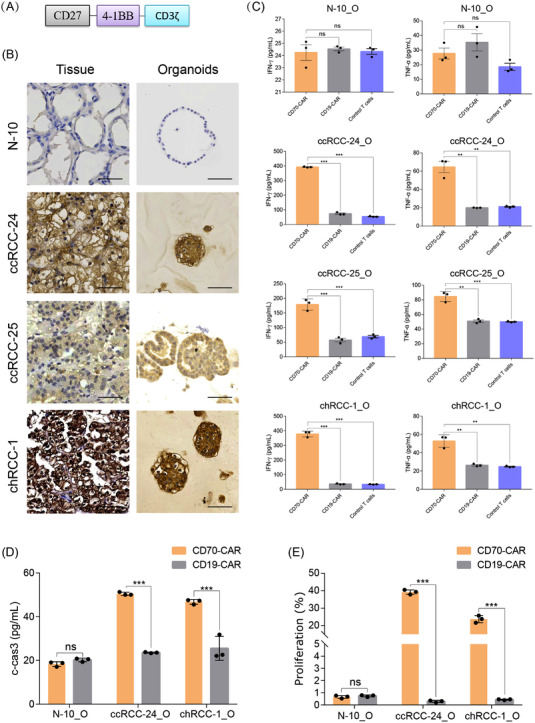
FIGURE 7.

Modelling immunotherapy with coculture of renal cell carcinoma (RCC) organoids and chimeric antigen receptor (CAR)‐T cells: (A) The structure of CD70‐specific CAR; (B) the expression level of CD70 in one normal kidney tissue–organoid pair N‐10, and three RCC tumour–organoid pairs clear cell renal cell carcinoma (ccRCC)‐24, ccRCC‐25 and chromophobe renal cell carcinoma (chRCC)‐1 by immunohistochemistry. Scale bar, 50 μm; (C) quantification of the production of tumour necrosis factor (TNF)‐α and interferon (IFN)‐γ by ELISA at 2 days after coculture of RCC organoids or normal kidney organoids with CD70 CAR‐T cells, CD19 CAR‐T cells or control CAR‐T cells; (D) the level of cleaved‐caspase‐3 in RCC or normal kidney organoids after coculture with CD70 CAR‐T cells, CD19 CAR‐T cells or control CAR‐T cells for 2 days; (E) quantification of the percentage of CFSE (carboxyfluorescein succinimidyl ester)‐labelled T cells after incubation with RCC or normal kidney organoids for 3 days. Values represent mean ± standard error of the mean (SEM) (n = 3). ns, not significant. **p < .01; ***p < .001 by two‐tailed, unpaired t‐test
