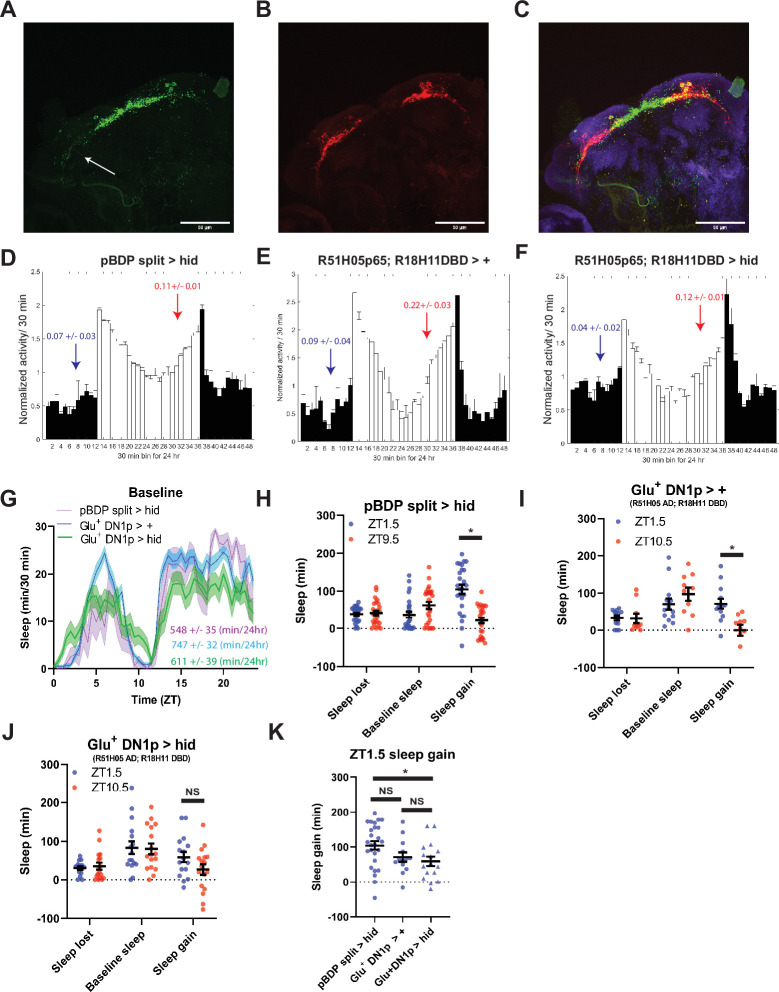
Figure 4. Glutamatergic DN1ps are necessary for morning and evening differences in rebound.
(A-C) 20 x images of split Gal4 line that labeling presynaptic (A), postynaptic (B) and overlay (C) of Glu+ DN1ps (R51H05 AD; R18H11 DBD >SYT GFP; DenMark) co-stained for BRP (blue). (D–F) Averaged activity eductions for female flies during the first 2 days of 12:12 LD. The light-phase is indicated by white bars while the dark-phase is indicated by black bars. Morning and evening anticipation indices are represented in blue and red respectively. (G) Average sleep during the baseline day for Glu+ DN1ps ablated (R51H05 AD; R18H11 DBD >hid) (N=30) (green), Gal4 control (R51H05 AD; R18H11 DBD> +) (N=36) and hid control (pBDP split >hid) (N=26) (purple). Sleep per 24 hr is indicated in the bottom right. (H–J) Comparison of sleep lost, baseline sleep, and sleep gain following deprivation at morning and evening timepoints in Glu+ DN1p ablated flies. Morning times are matched with evening time points with similar baselines. (H) hid control flies with no ablated neurons (pBDP split >hid) (N=26) exhibit greater rebound in the morning compared to matched evening time point (p<0.0001, paired t-test). (I) Gal4 control flies with no ablated neurons (R51H05 AD; R18H11 DBD> +) (N=19) exhibit greater rebound in the morning compared to matched evening time point (p<0.01, paired t-test) (J) Flies with Glu+ DN1ps ablated (R51H05 AD; R18H11 DBD >hid) (N=21) do not exhibit a significant difference in sleep gain between matched morning/evening time points (p>0.09, paired t-test). (K) Comparison of sleep gain at ZT1.5 between flies with Flies with Glu+ DN1ps ablated (R51H05 AD; R18H11 DBD >hid) (N=21) and their controls (pBDP split >hid) (N=26) and (R51H05 AD; R18H11 DBD> +) (N=19). R51H05 AD; R18H11 DBD >hid flies exhibit significantly less rebound at ZT1.5 compared to hid control (p<0.05, ANOVA) and a non-significant decrease compared to Gal4 control (p>0.05, ANOVA). Data are means +/- SEM.


