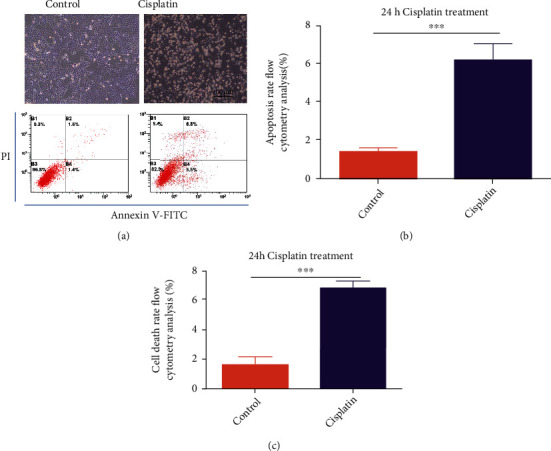
Figure 2.

Cisplatin-induced HEI-OC1 cell death. (a) Light field and flow cytometry analysis after cells were treated with 25 μM cisplatin for 24 h. (b) Number of early apoptotic cells in A. (c) Number of dead cells in A. ∗p < 0.05, ∗∗p < 0.01, and ∗∗∗p < 0.001. Scale bar, 100 μm.
