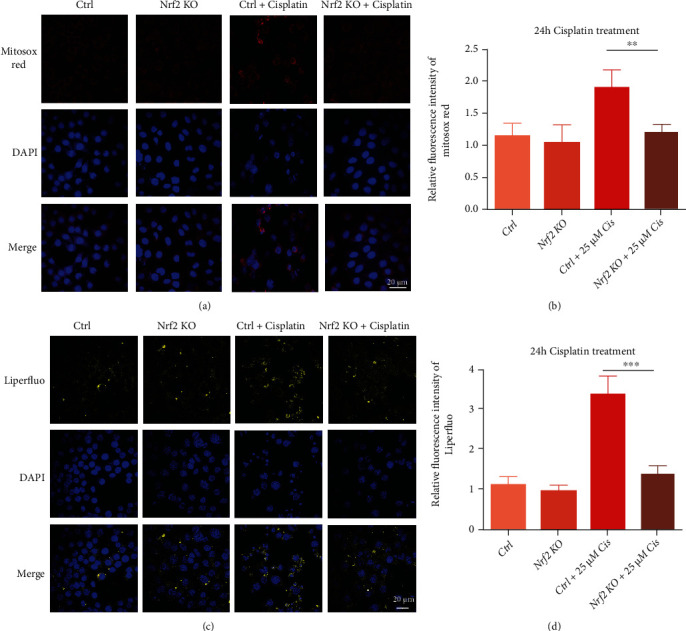
Figure 6.

Nrf2 KO alleviated mitochondrial ROS and lipid peroxide levels after cisplatin treatment. (a) MitoSOX Red staining indicated mitochondrial ROS accumulation in cells after treatment with 25 μM cisplatin for 24 h. (b) Relative fluorescence intensity of MitoSOX Red in the cells in A. (c) Liperfluo indicated the lipid peroxide levels in cells after treatment with 25 μM cisplatin for 24 h. (d) Relative fluorescence intensity of Liperfluo in the cells in C. ∗p < 0.05, ∗∗p < 0.01, and ∗∗∗p < 0.001. Scale bar, 20 μm.
