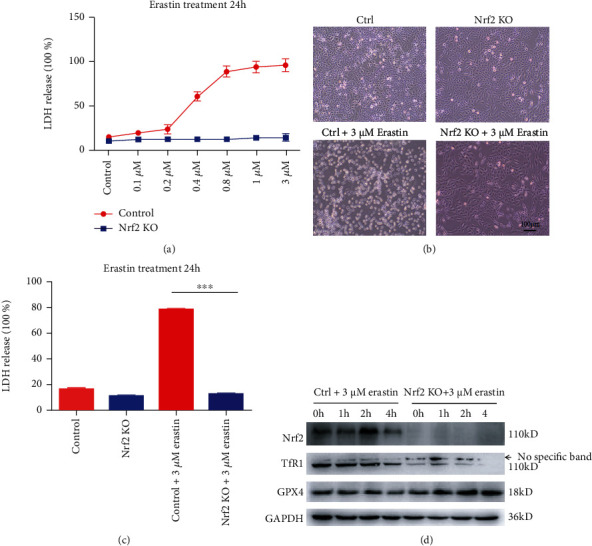
Figure 8.

Nrf2 KO cells were resistant to the ferroptosis inducer erastin. (a) LDH release levels in control and Nrf2 KO cells treated with different concentrations of erastin for 24 h. (b) Image showing control and Nrf2 KO cells after 3 μM erastin treatment for 24 h in a light field. (c) LDH release levels in B. (d) Western blots of Nrf2, CTR1, TfR1, and GPX4 protein expression in control and Nrf2 KO cells treated with 3 μM erastin at different time points. ∗p < 0.05, ∗∗p < 0.01, and ∗∗∗p < 0.001. Scale bar, 100 μm.
