
FIG. 1.
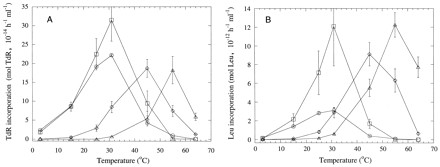
Mean TdR and Leu incorporation rates of bacterial communities in peat samples from Bliksrud, Killingmo, and Komnes incubated for 72 h at different temperatures. The x axis shows the incubation temperature of the extracted bacterial suspensions during incorporation of labeled substrate. Different symbols denote the incubation temperatures of peat before measurements as follows: ○, 25°C; □, 35°C; ◊, 45°C; and ▵, 55°C. Bars indicate standard errors (n = 3).