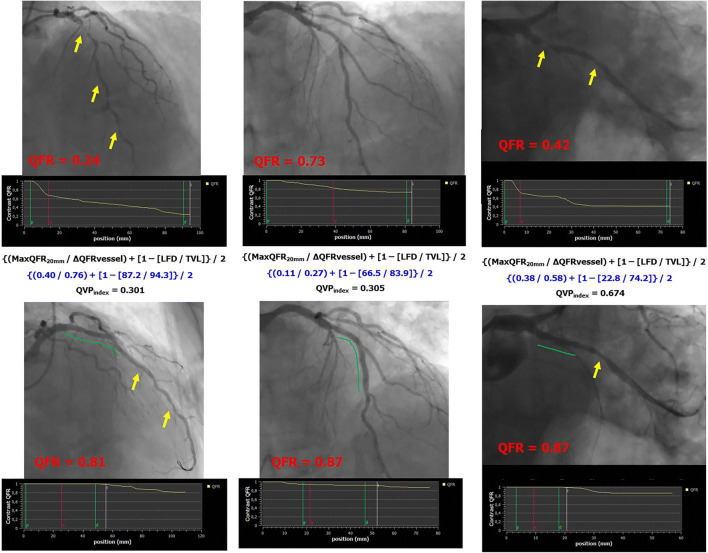
Fig. 4.
Examples of suboptimal PCI in vessels with intermediate-low QVPindex. QFR, quantitative flow ratio; MaxQFR20mm, maximal drop of QFR value in 200 mm; ΔQFRvessel, difference in the QFR values from the beginning to the end of the vessel; LFD, length of the vessel with functional disease; TVL, total vessel length; QVPindex, QFR virtual pullback index; PCI, percutaneous coronary intervention. Yellow arrows indicate the presence of coronary lesions before or after PCI, whereas green lines indicate stented segments in post-PCI images

