
Fig. 3.
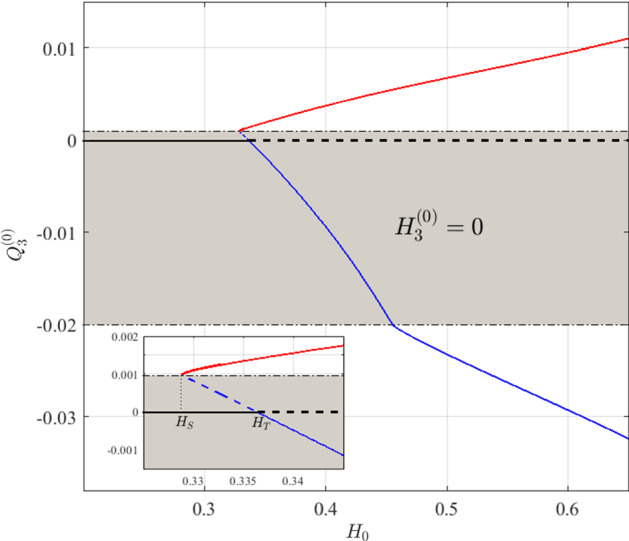
Steady state solutions for as a function of the inlet haematocrit, , when Each solution branch is illustrated with a different line colour, with the black line representing the trivial solution. Solid and dashed lines correspond to stable and unstable solutions, respectively. The region of Hopf instability analysed in Sects. 3.3–3.4 is not indicated in this figure. The grey area bounded by the dash-dotted lines is the region in which the steady-state solutions have no haematocrit in vessel 3. The inset shows an enlarged image of the two bifurcations: (i) the saddle-node bifurcation, , from which the red and blue solutions originate; (ii) the transcritical bifurcation, , at which the blue and black (trivial) solutions exchange stability (Color figure online)