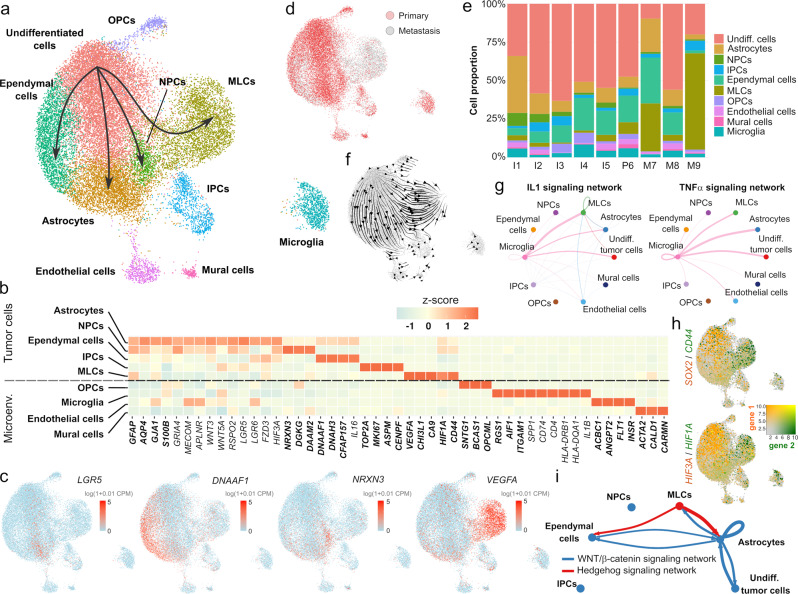
Fig. 1. Single-nucleus RNA-seq uncovers the gene expression programs of primary and metastatic posterior fossa ependymoma.
a Single-nucleus RNA-seq data of 25,349 cells from nine tumors. The UMAP representation of the data is colored and annotated by the 10 cell populations identified. The four tumor-derived cell lineages are indicated by arrows. b Selected differentially expressed genes for tumor-derived and non-tumor cell populations, including marker genes (bold) that were used to annotate the cell populations, as well as differentially expressed genes discussed in the main text. Neuroepithelial-like tumor cell populations (undifferentiated cells, astrocytes, NPCs, and ependymal cells) express multiple genes coding for components of the WNT signaling pathway, whereas MLCs express high levels of hypoxia- and angiogenesis-related genes, and microglia express pro-inflammatory cytokines. c The UMAP representation is colored by the expression level of several differentially expressed genes that are associated with individual tumor-derived cell populations. d UMAP representation showing the origin (primary/metastasis) of each cell. The mesenchymal-like cell population is mostly associated with metastatic tumors. e Stacked bar chart depicting the proportions of each cell type in each tumor. f RNA velocity stream plot. The inferred cell differentiation trajectories originate in the undifferentiated tumor cell population and are consistent with the four lineages of tumor-derived cells indicated in a. g IL1 (top) and TNF-α (bottom) cell-to-cell signaling networks inferred by CellChat based on differentially expressed genes that code for ligands and receptor/co-receptors. The two networks show abundant pro-inflammatory signaling from microglia onto the tumor cells. h The UMAP representation of the single-nucleus RNA-seq data is colored by the expression level of some of the differentially expressed genes between neuroepithelial- and mesenchymal-like tumor cell populations. The UMAPs depict the expression of SOX2 and CD44 (top), and HIF3A and HIF1A (bottom). i Cell-to-cell WNT and hedgehog signaling networks inferred by CellChat indicating a switch between WNT signaling in neuroepithelial-like tumor cell populations and hedgehog signaling in MLCs. IPCs intermediate progenitor tumor cells, MLCs mesenchymal-like tumor cells, NPCs neural progenitor tumor cells, OPCs oligodendrocyte progenitor cells.

