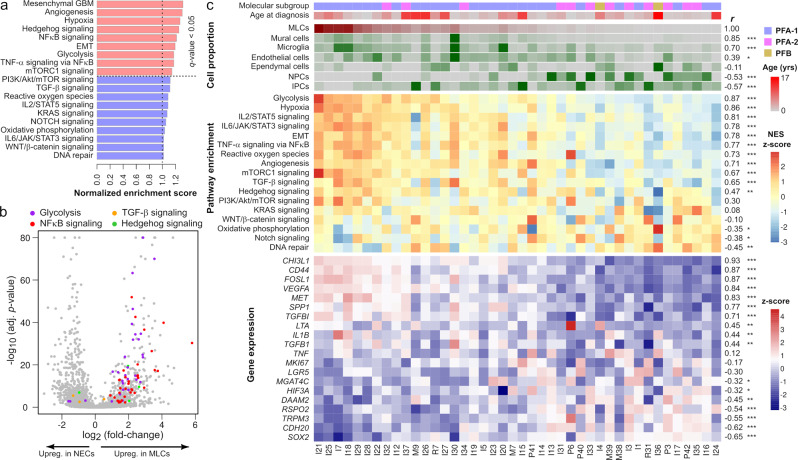
Fig. 2. The mesenchymal-like tumor cell population of posterior fossa ependymoma is associated with hypoxia, angiogenesis, glycolysis, and NFκB signaling gene expression programs.
a GSEA in the MLC population showing enrichment for hypoxia, angiogenesis, glycolysis, NFκB, and other signaling pathways in this population. Normalized enrichment scores larger or smaller than 1 indicate an enrichment or depletion of the gene set in the MLC population, respectively. b Volcano plot showing differentially expressed genes between neuroepithelial- and mesenchymal-like tumor cells, where genes belonging to glycolysis, NFκB signaling, TGF-β signaling, and hedgehog gene sets are indicated (Fisher’s method combined p value, adjusted for multiple hypothesis testing using Benjamini-Hochberg procedure). c The single-nucleus gene expression data were used to infer cell population abundances in a cohort of 42 pediatric posterior fossa ependymal tumors profiled with bulk RNA-seq by CBTN. Tumors are arranged from left to right by decreasing inferred abundance of MLCs. From top to bottom, the molecular subgroup, age of diagnosis, inferred abundance of distinct cell populations, GSEA scores of various representative signaling pathways, and expression of representative genes are shown. On the right side, the Spearman’s correlation coefficient of each of these features with the inferred abundance of MLCs and its level of significance are indicated (two-sided test of association; *FDR , **FDR , ***FDR ). Numeric q values are provided in the Source Data file. IPCs intermediate progenitor tumor cells, MLCs mesenchymal-like tumor cells, NPCs neural progenitor tumor cells, NECs neuroepithelial-like tumor cells.

