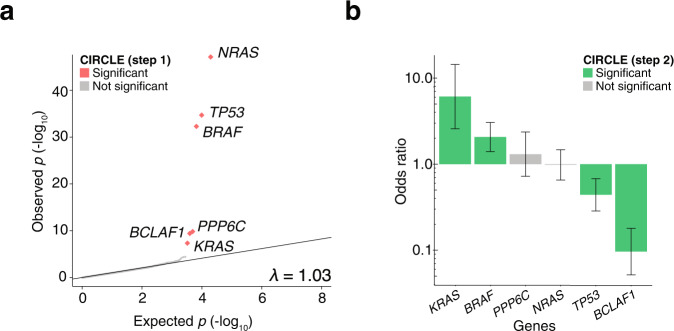
Fig. 2. A two-stage approach identifies BCLAF1 somatic genotype as a predictor of ICB response.
a Quantile-quantile plot of fishHook p-values to assess significance of gene mutational burden after removing confounders. The p-values were obtained by comparing observed mutational rate to the right tail (one-sided) of the expected mutational rates derived from a gamma-Poisson model of genome-wide mutational density and the covariates replication timing, epigenetic state, and sequence context. In the first stage of CIRCLE, six significant genes were identified below a false-discovery threshold (FDR < 0.1). b Odds ratios (ORs) of response to ICB therapy in patients with a high or moderate impact mutation in the indicated gene as compared to patients that do not have a high or moderate mutation in the given gene (n = 272 patients). Error bars indicate the 95% confidence interval of the odds ratio. ORs greater than one indicate enrichment in responders and ORs less than one indicate enrichment in non-responders. Statistical significance was tested using a two-sided Wald’s test of coefficients with multiple-hypothesis correction (FDR < 0.2).

