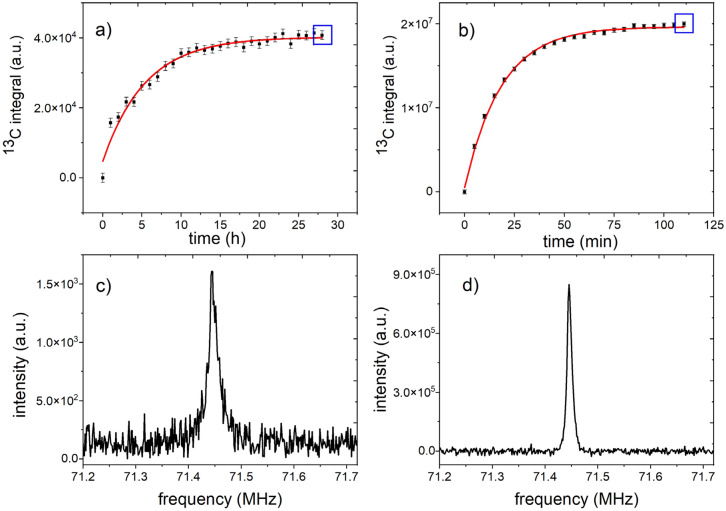
Figure 5.
Quantification of solid-state polarization. Solid-state, 13C-NMR signals of 14 M 1-13C pyruvic acid mixed with 30 mM radical (112.3 mg total sample weight) monitored with low flip angle excitations ( ~ 0.32°, NS = NX = 256, TR = 1 h (a) or TR = 5 min (b)) while reaching thermal equilibrium at ≈ 1.4 K and 6.7 T (a) and during DNP (b). Blue squares indicate the spectra shown below (c, d). By fitting a mono-exponential recovery function (Eq. 5) to the polarization build up without µW (a) and with µW (b) and correcting for the RF excitations (Eq. 6), a solid-state relaxation , signal at thermal equilibrium , DNP build-up time TDNP = (18.396 ± 0.49) min and equilibrium signal = ( ± ) a.u. were obtained (note that this build up is faster than for the standard sample). The polarization of the spectrum acquired after 110 min DNP was quantified to (110 min) = (110 min) / ≈ 64%. Without RF excitations the expected steady state signal is estimated to be = / ≈ 61% The spectra (c) and (d) are the last measured thermal recovery and DNP spectra (marked on (a) and (b) with blue rectangles). The first six datapoints in (a) were neglected for the fit because of very low SNR.

