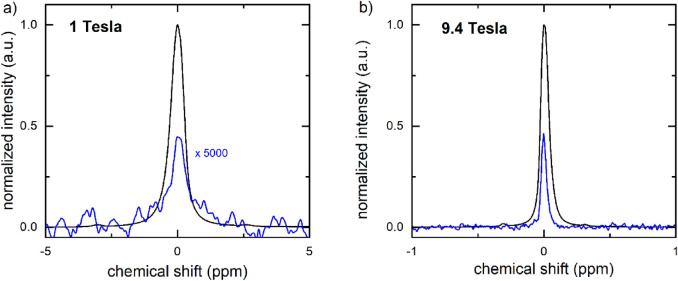
Figure 6.
High resolution 13C-NMR spectra of hyperpolarized (black) thermally polarized (blue) 1-13C-PA measured at 1 T (a) and 9.4 T (b). (a) The hyperpolarized signal was measured in a single scan (NSDNP = 1) after approx. 26 s after dissolution ( = 5°, pw = 3.05 µs, pa = − 5.6 dB, SDNP = 32.38 a.u.). The thermally polarized signal was acquired adding 4 vol% Gd contrast agent ( = 20°, pw = 12.20 µs, pa = − 5.6 dB, SDNP = 4.18 × 10⁻⁴ a.u.). The resulting signal enhancement to SDNP was 1.09 × 10⁹ (Eq. 8), and the polarization = 26% (Eqs. 9, 10). (b) At 9.4 T, the signal was acquired ≈ 30 s after dissolution using a 5° pulse (SDNP = 7.59 × 10⁵ a.u., pw = 10 µs, pa = − 18.9 dB, RG = 0.25) and quantified with respect to the thermally polarized signal acquired with a single 90° pulse (STP = 1.41 × 10⁵ a.u., pw = 0.55 µs, pa = − 18.9 dB, RG = 101) to an enhancement of 2.5 × 10⁴ (Eq. 8) and polarization of 20% (Eqs. 9, 10). Note that due to the differences in the RG, both hyperpolarized spectra were normalized to 1 and the thermal spectrum measured at 1 T was multiplied by 5000 to fit in the scale.

