
Figure 4.
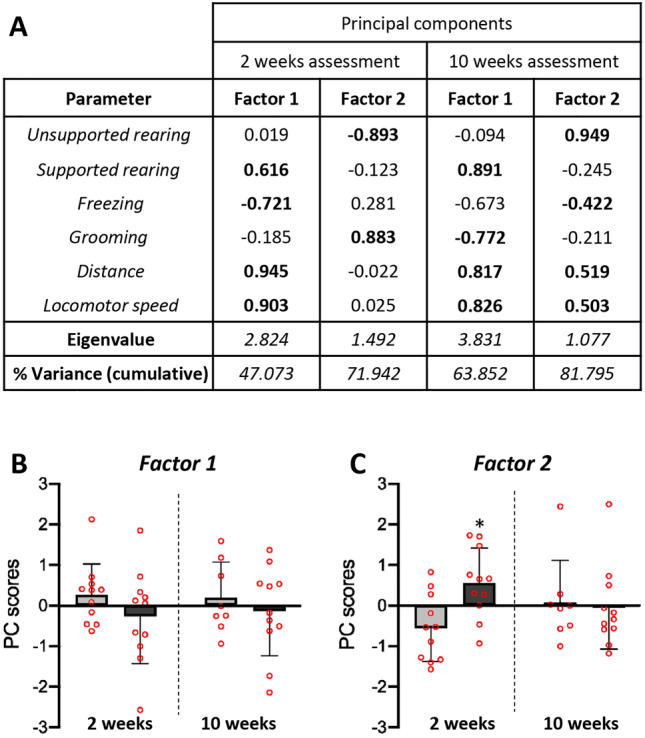
Principal component analysis (PCA) carried out with behavioral parameters obtained in the open field test. The PCA was carried out with the data obtained in the behavioral assessment performed at 2 weeks (2w) post-ICV injection as well as 10 weeks (10w) post-ICV injection. For the data obtained in the 2 weeks assessment KMO = 0.506, χ2 = 83.839, and P < 0.001. For the data from 10 weeks assessment KMO = 0.758, χ2 = 128.546, and P < 0.001. The PC scores for each of the parameters used in the PCA and the factors resulting (Eigenvalue > 1) from the analysis are presented (A). Interpretable factor loadings (> 0.50) are highlighted in bold, being positively or inversely correlated with each factor. The parameters’ scores in each factor suggest to relate Factor 1 to locomotor capacity, and Factor 2 to the animal’s emotional state. Representation with histograms of the PC scores for Factor 1 (B) and Factor 2 (C) obtained in the PCA at both evaluation times. Animals ICV-injected with NA showed the highest score for Factor 2 after 2 weeks of the ICV. In order to reveal any significant difference between treatments, a Student’s t-test was conducted. The bars represent the mean value ± SEM. Significant differences are shown with asterisk: *p < 0.05.