Figure 7.
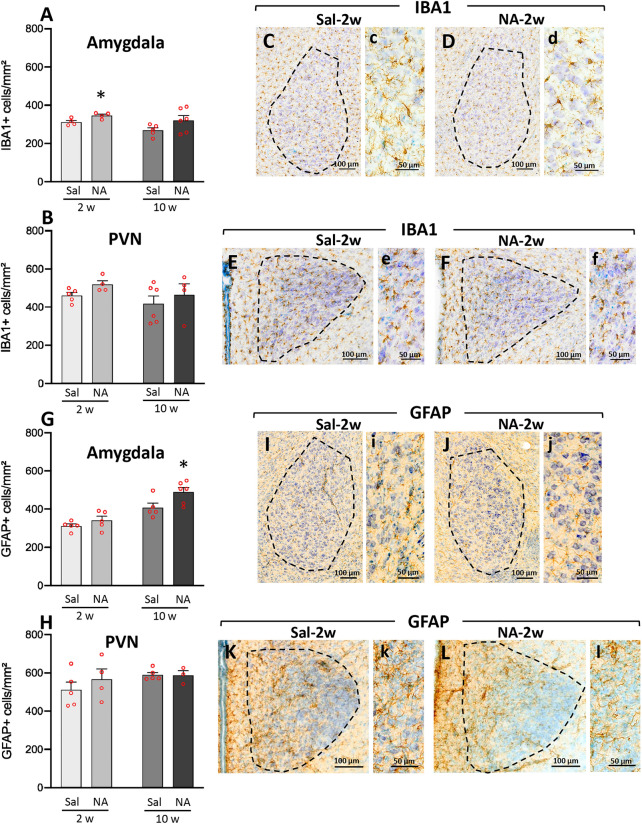
IBA1-positive and GFAP-positive cell counts in amygdala and hypothalamic PVN after neuraminidase induced neuroinflammation. Rats ICV-injected with saline (Sal) or with neuraminidase (NA) were sacrificed 2 weeks (2w) or 10 weeks (10w) after the ICV. Their brains were removed and processed for immunostaining with IBA1 (a widely used marker of microglial cells) or GFAP (a marker of astrocytes). Positive cells are labeled in brown; sections were counterstained with toluidine blue. IBA1-positive cell counts were carried out in two regions related to anxiety and to the stress response: the amygdala (A) and the hypothalamic paraventricular nucleus (PVN; B). In the same way, GFAP-positive cell counts were performed in the amygdala (G) and the PVN (H). The bars in histograms represent the mean ± SEM of n = 5–6 animals per experimental group. Student’s t-test were performed in order to check the influence of treatment (Sal versus NA) at both time assessments on the number IBA1-positive or GFAP-positive cells (*p < 0.05). Representative images of IBA-1 labeled amygdala (C,D) and PVN (E,F) are shown, as well as GFAP labeled amygdala (I,J) and PVN (K,L), all from animals sacrificed 2 weeks after the injection; the area of interest where the cell count was performed is delimited with a broken line. Images c–f (on the right of C–F) and i–l (on the right of I–L) are a magnified detail of each respective photograph.

