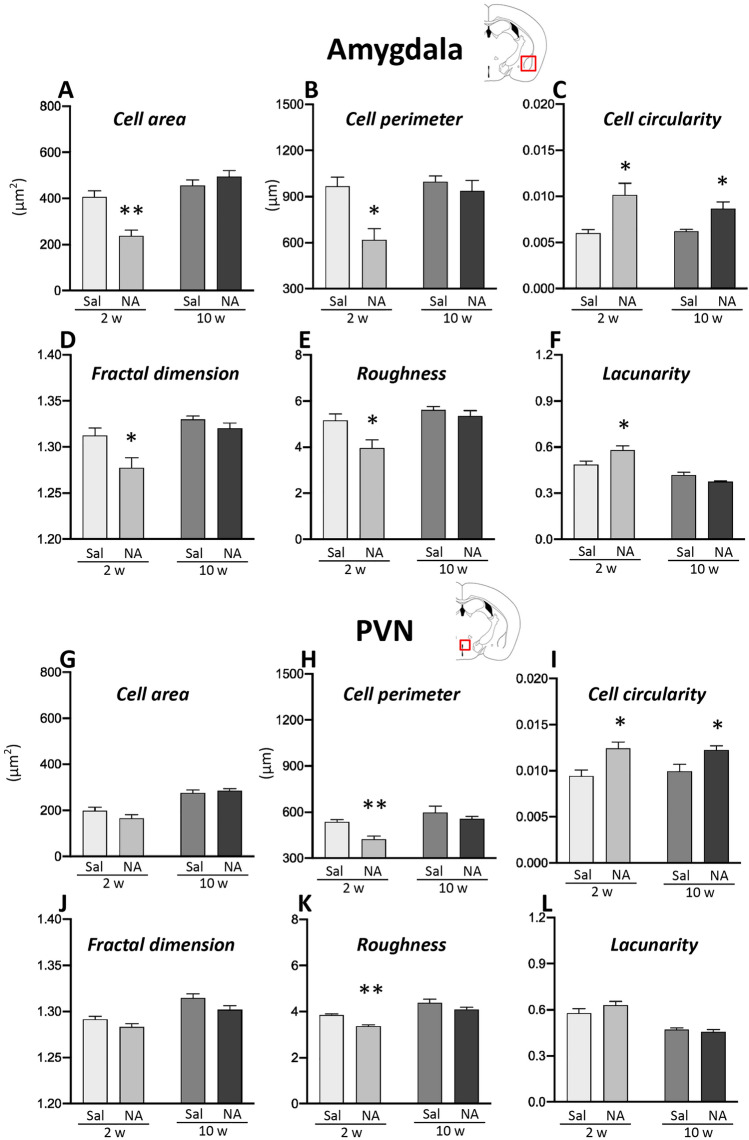
Figure 8.
Morphological parameters of microglial cells sampled from the amygdala and PVN of rats subjected to NA-induced neuroinflammation. Rats ICV-injected with saline (Sal) or with neuraminidase (NA) were sacrificed 2 weeks (2w) or 10 weeks (10w) after the ICV injection. Histological sections obtained from their brains were immunostained for IBA1. Images of individual microglial cells located in the amygdala or the PVN were processed to measure morphological parameters. Student’s t-test was performed in order to check the influence of treatment (Sal versus NA) on microglia morphology sampled from different experimental groups at both time points. Here are shown only some of the parameters measured (other parameters available in Supplementary material S1): cell area (A,G), cell perimeter (B,H), cell circularity (C,I), fractal dimension (D,J), roughness (E,K) and lacunarity (F,L). The bars in histograms represent the mean value ± SEM of n = 50–57 cells for amygdala (A–F) and n = 40–60 cells for PVN (G–L) per experimental group. Morphological differences between NA and saline treated groups are more evident in amygdala 2 weeks after the ICV-injection, while after 10 weeks most parameters (except for C, cell circularity) are similar in both groups. In PVN differences between NA and saline groups are scarce (see H,I and K, cell perimeter, cell circularity and roughness). *p < 0.05; **p < 0.005.

