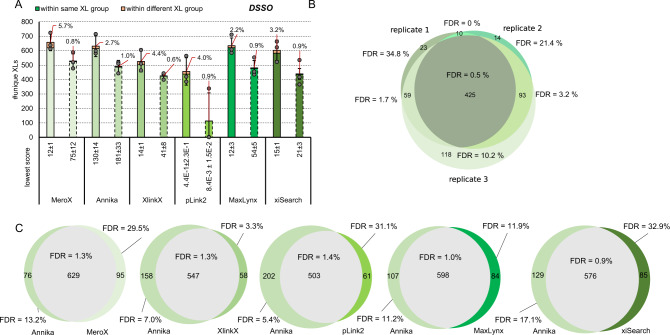
Fig. 2. Benchmarking of data analysis tools on the example of DSSO.
A Average crosslink numbers using DSSO after acquisition using a stepped HCD MS2 method. Applied to the main library using the algorithms MeroX26, MS Annika24, XlinkX27, pLink 228, MaxLynx25 or xiSearch36, 44 for analysis. All results were obtained at 1% estimated FDR (solid line bars) and corrected by applying a post-score cutoff to reach an experimentally validated FDR < =1 (dashed line bars). The experimentally validated FDR is shown as callout, error-bars indicate standard deviations of average values, n = 3 independent samples acquired on different days. B Overlap of crosslinks identified in each replicate using MS Annika. C Overlap of cross links identified in replicate 3 after analysis using MS Annika or an alternative algorithm as given. B, C: Experimentally validated FDRs for commonly found and exclusively found links are given. Source data are provided as a Source Data file.

