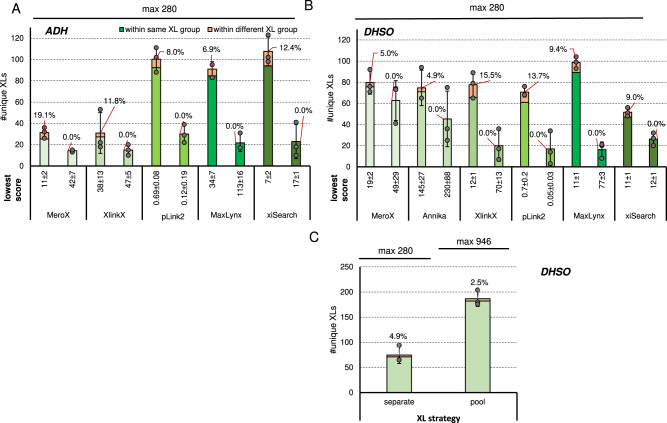
Fig. 4. Benchmarking linker reagents reactive to acidic amino acids.
Average number of unique link IDs and maximal theoretical number of true crosslink combinations after acquisition using a stepped HCD MS2 strategy when using ADH (A) or DHSO (B) to crosslink the acidic library. Data analysis was performed using the indicated algorithm at 1% estimated FDR (solid line bars) and corrected by applying a post-score cutoff to reach an experimentally validated FDR < = 1 (dashed line bars). C As B but when crosslinking the library either in separate groups or adding the linker to a pool of all peptides to boost resulting ID numbers. Data analysis using MS Annika at 1% estimated FDR. A–C The experimentally validated FDR is shown as callout, error-bars indicate standard deviations of average values, n = 3 independent samples acquired on different days. Source data are provided as a Source Data file.

