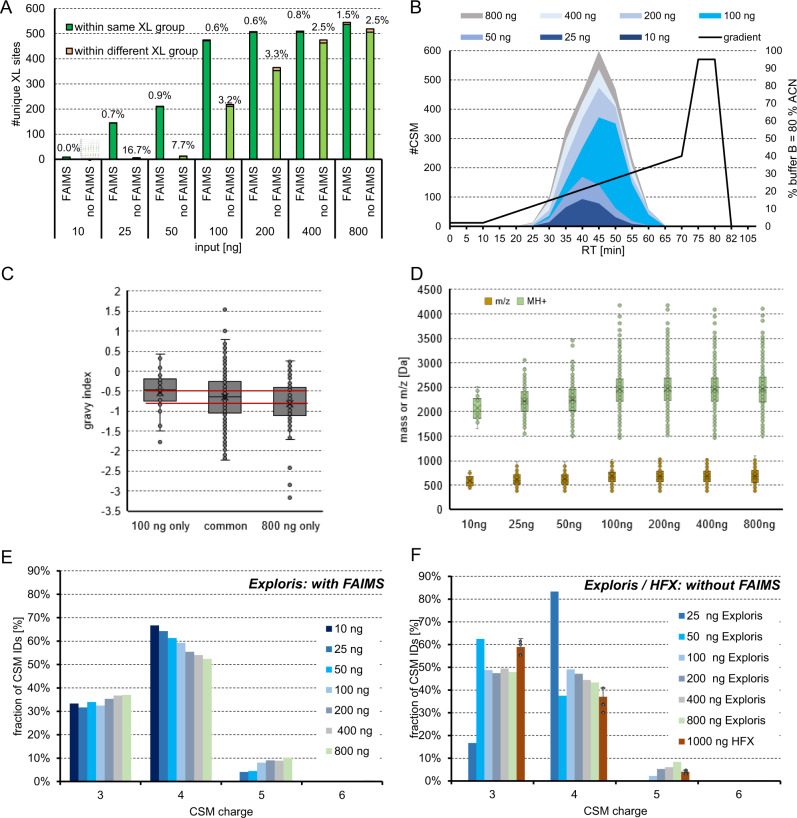
Fig. 8. Variation of input amount and physicochemical properties of crosslinks.
Lowered input amounts, as indicated, of the DSSO cross-linked main library were measured on an Orbitrap Exploris 480 using a stepped HCD MS2 strategy. Data was analyzed using MS Annika at 1 % FDR. A Unique crosslinks with or without FAIMS attached and experimentally validated FDR is given above bars. B Distribution of spectral matches over retention time and used gradient with FAIMS. C Distribution of hydrophobicity of CSMs identified exclusively in the 100 or 800 ng sample or in both samples (measured with FAIMS). D Distribution of identified cross-linked peptide masses of CSMs (M + H) and m/z in dependence of used input amount. (measured with FAIMS) C, D Boxplots depict the median (middle line), upper and lower quartiles (boxes), 1.5 times of the interquartile range (whiskers) as well as outliers (single points), this data is from a single replicate. E Charge distribution obtained with FAIMS using CVs −50, −55 and −60 for acquisition and stepwise changing the input amount from 10 – 800 ng or (F) without FAIMS when acquiring on HFX or Exploris instrument. Error bars indicate standard deviations of average values, experimentally validated FDR is shown as callout, n = 3 independent samples acquired on different days. Source data are provided as a Source Data file.

