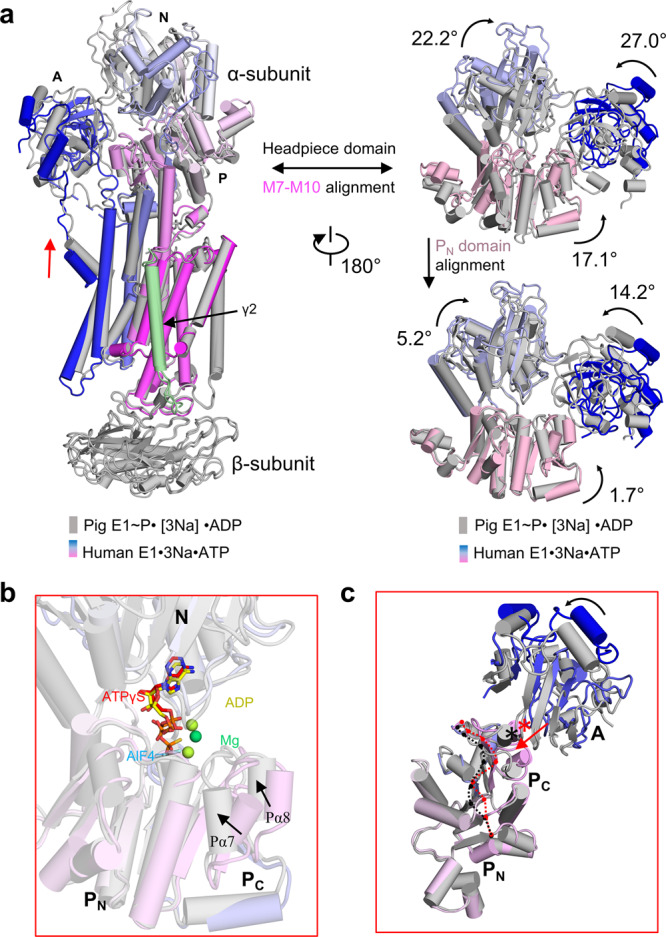
Fig. 4. P domain conformation change causes cytoplasmic gate closure.

a Structural comparison of the E1·3Na·ATP (blue to magenta) with E1~P·[3Na]·ADP (grey) states with the movement of the M1 helix and cytosolic headpiece shown. The structures are superimposed with M7–M10 or the PN domain (598–710 residues). Red arrows represent closing of the M1 sliding door. b, c The structures are superimposed with the PN domain (598–710 residues) between the E1·3Na·ATP and E1~P·[3Na]·ADP states. The ATP (red) and ADP (yellow) binding pockets between the N and P domains are shown in (b). The PN and PC half domains have a bent conformation in the E1·3Na·ATP state (indicated by the red dashed line) or an unbent confirmation in the E1~P·[3Na]·ADP state (indicated by the black dashed line), respectively. The A domain sitting on a helix (Pα8) are denoted with asterisk in E1·3Na·ATP (red) and in E1~P·[3Na]·ADP (black). Red arrow indicates movement of Pα8 during transition from the E1·3Na·ATP state to the E1~P·[3Na]·ADP state.
