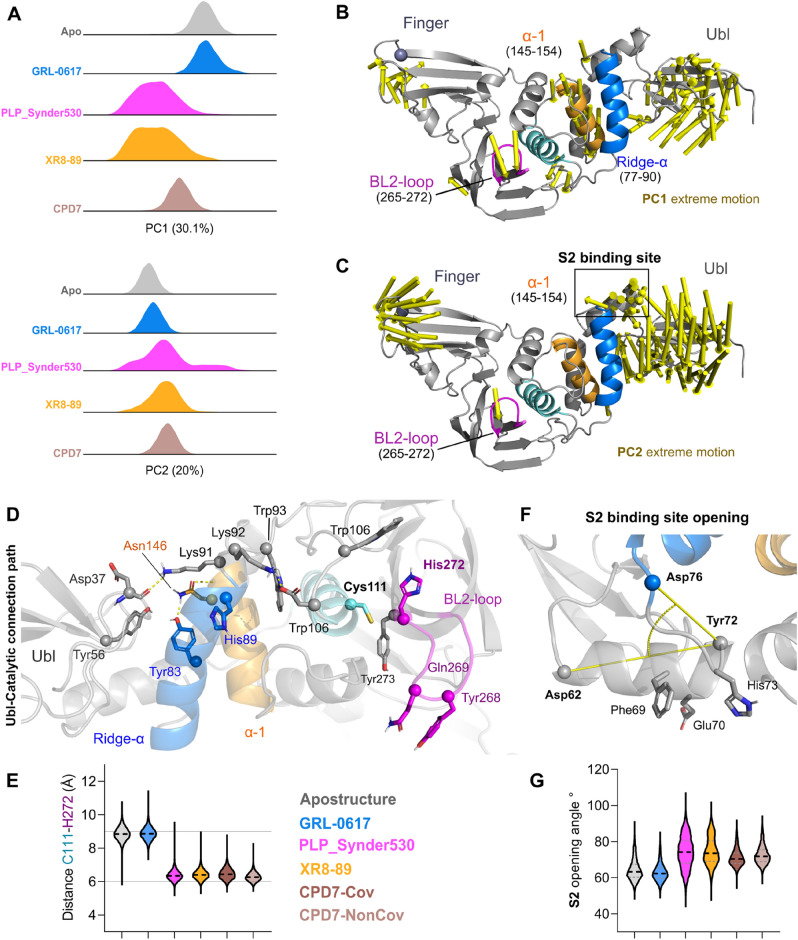
Figure 2.
SARS-CoV-2 PLpro principal component analysis. (A) Distributions over the two significant PCs (PC1 and PC2) separated for each simulated system apostructure (PDB: 7lbr) is highlighted in grey; GRL-0617 bound structures (GLR067-7JIR) in sky-blue; PLP_Synder530 bound structures (PLP_Synder530 - 7JIW) in magenta, XR8-89 bound structures (XR8-89 - 7LBR) in orange and CPD7 bound structures (CPD7) in dark brown. (B) Extreme motions from the PC1 displayed over the PLpro tertiary structure represented by arrows. (C) Extreme motions from the PC2 displayed over the PLpro tertiary structure represented by arrows. (D) Ubl-Catalytic connection path, with relevant residues highlighted as sticks (E) Distance values between C111 to H272 along with the simulations depicting the full extension of the inhibitor binding site opening. (F) S2 binding site opening representation, and (G) S2 vector angle analysis describing the opening/closing of this region. For E and G, ligands are coloured according to figure legend.

