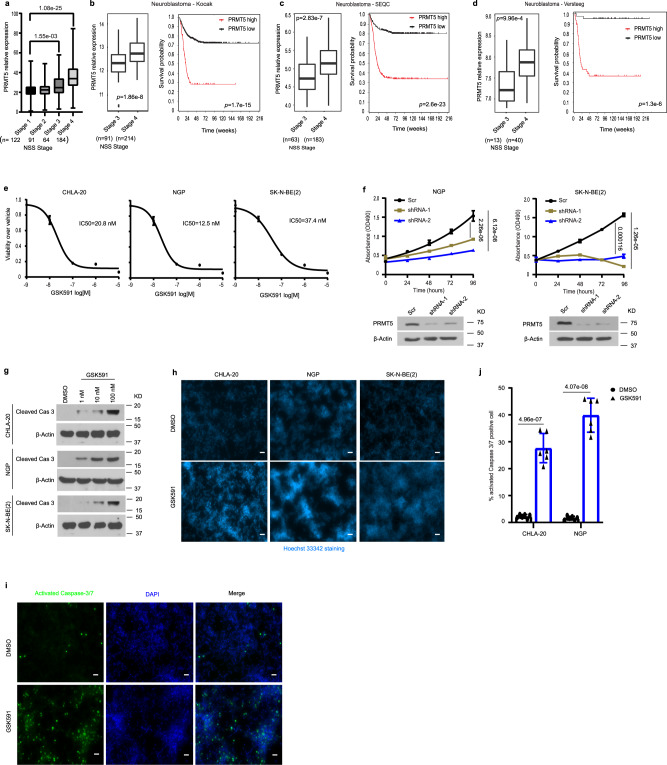
Fig. 1. Overexpression of PRMT5 is associated with high-risk neuroblastoma and poor patient survival and is required for neuroblastoma cell proliferation in vitro.
a The RNA expression of PRMT5 in increasing grades of neuroblastoma from the GSE49711 RNA-seq data series (Stage 1, n = 122, Stage 2, n = 91, Stage 3, n = 64, Stage 4, n = 184). Kruskal–Wallis with Dunn’s multiple comparisons test was used to determine p values, which were corrected with the Benjamini–Hochberg method.). b–d PRMT5 expression levels (left) and patient survival probability (right) in stage 3 and stage 4 neuroblastoma patients in Kocak (b, Stage 3, n = 91, Stage 4, n = 214), SEQC (c, Stage 3, n = 63, Stage 4, n = 183), and Versteeg (d, Stage 3, n = 13, Stage 4, n = 40) databases. P values were calculated with a two-sided Wilcoxon rank-sum test for boxplots (left) and p values were calculated with a log-rank test for survival curves (right). a–d Boxplot center represents mean, the box represents SD, and whiskers represent minimum and maximum. e The efficacy of PRMT5 small molecule inhibitor GSK3203591 (GSK591) was determined by MTS assay in CHLA20, NGP, and SK-N-BE (2) cells (n = 3). The IC50 value was determined by nonlinear regression (curve fit) using log10 (inhibitor) versus response (three parameters) model in GraphPad Prism. f Cell viability was measured by MTS assay in a scramble or shRNA targeting PRMT5 in NGP (left) and SK-N-BE (2) cells (right) (n = 4). g Cleaved caspase-3 levels in neuroblastoma cell lines treated with increasing doses of GSK591. h Hoechst 33342 staining in cells treated with DMSO or 100 nM GSK591. Scale bars, 100 μm. i Apoptosis was measured by caspase-3/7 staining in CHLA20 cells treated with DMSO or GSK591. j Quantification of caspase-3/7 positive cells (n = 6). f, j p values were indicated by a two-tailed unpaired Student’s t-test using Microsoft Excel; error bars represent SD (e–j). e–i Representative results from three independent experiments. Uncropped immunoblots are provided in the Source Data file.

