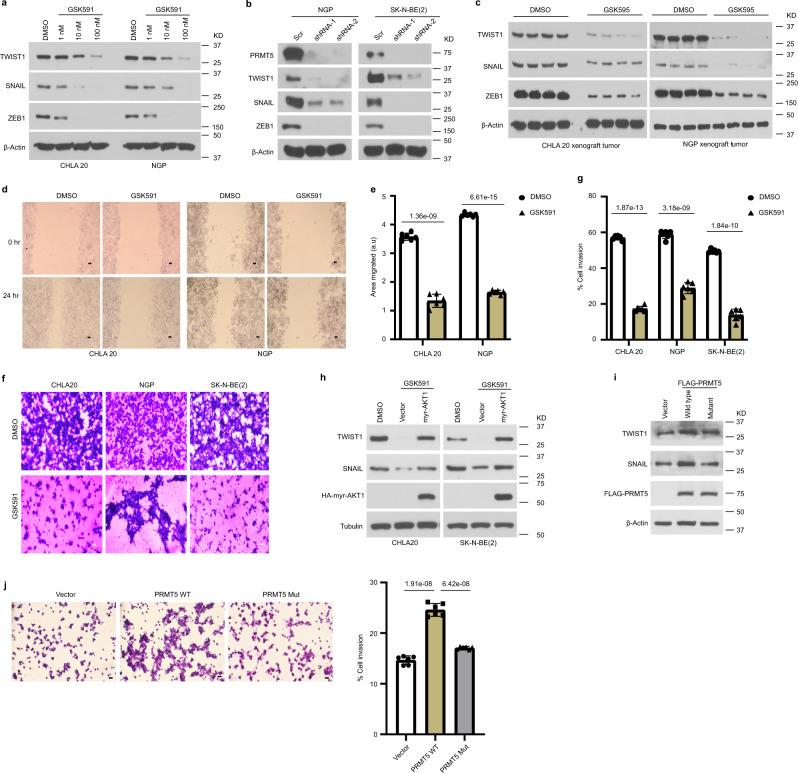
Fig. 6. PRMT5/AKT regulates the EMT program.
a Immunoblots showing the expression of TWIST1, SNAIL, and ZEB1 in neuroblastoma cells treated with DMSO or increasing doses of GSK591 in CHLA20 and NGP cells. b Analysis of TWIST1, SNAIL, and ZEB1 protein levels in the scramble and shPRMT5 cells. c The expression of EMT transcription factor TWIST1, SNAIL, and ZEB1 was examined in xenograft tumors from mice treated with vehicle or GSK595 (n = 4). d Representative images of DMSO or GSK591-treated cells migrated to the cleared space (wound) after 24 h. Scale bars, 100 μm. e Quantification of in vitro cell migration assay (n = 6). The migration area was determined by measuring the total area of the wound using the ImageJ software. f Representative images of DMSO or GSK591-treated cells invaded to ECM coated membrane in transwell invasion assay. Scale bars, 100 μm. g Percentage of invasive cells normalized by cell numbers in the non-ECM coated 12-well plate using ImageJ (n = 6). h Protein levels of TWIST1 and SNAIL were analyzed in DMSO or GSK591-treated cells transfected with a vector or constitutively activated AKT1. i The protein levels of TWIST1 and SNAIL in cells overexpressing PRMT5 wild type or enzyme activity deficient mutant by Western blotting. j Representative images of CHLA20 cells overexpressing vector, wild type PRMT5, or an enzymatic deficient form of PRMT5 invaded to ECM coated membrane in the transwell invasion assay (left). Scale bars, 100 μm. Percentage of invasive cells normalized by cell numbers in the non-ECM coated 12-well plate using ImageJ (n = 6) (right). e, g p values were calculated by two-tailed unpaired Student’s t-test using Microsoft Excel. j p values were determined using one-way ANOVA with Tukey’s multiple comparisons test. Error bars represent SD. a, b, d–j Representative results from three independent experiments and the results shown are from a representative experiment. Uncropped immunoblots are provided in the Source Data file.

