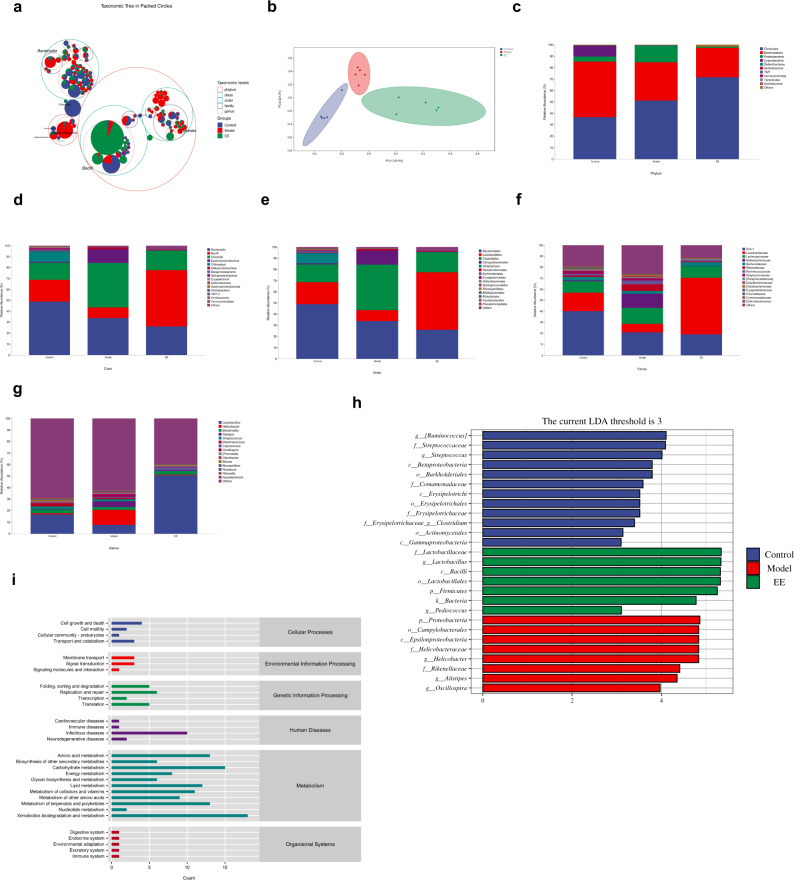
Fig. 3. EE intake reshapes the gut microbiota in irradiated mice.
a Taxonomic tree in packed circles. b Principal coordinates analysis plot of Bray–Curtis. c The relative abundance of bacteria at phylum level; d the relative abundance of bacteria at class level; e the relative abundance of bacteria at order level; f the relative abundance of bacteria at family level. g The relative abundance of bacteria at genus level. h Linear discriminant analysis (LDA) effect size showing the most differentially significant abundant taxa enriched in microbiota among the EE group, model group, and control group. (LDA > 3). i Microbial functions were predicted by PICRUSt2 upon KEGG (n = 5).

