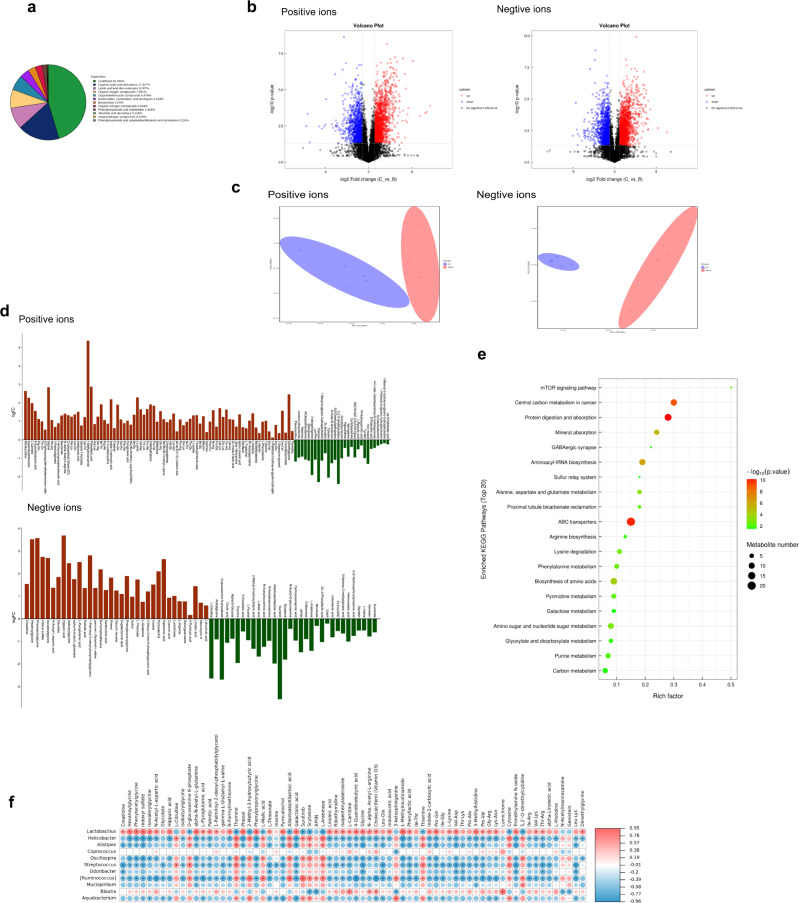
Fig. 4. EE supplementation changed the fecal metabolites in irradiated mice.
a Statistics of chemical Taxonomy of metabolites. b The volcano plot of the fecal metabolites. (Metabolites with FC > 1.5 and p value < 0.05 were represented in red; metabolites with FC < 0.67 and p value < 0.05 were represented in blue. Non-significant metabolites are shown in black). c The PCA plot of the fecal metabolites. d Differential multiple analysis of metabolites with significant differences. (OPLS-DA, VIP > 1 and p value < 0.05, student’s t-test). e The results of the metabolic pathway enrichment analysis. f Correlation analysis among the gut microbiota and metabolites with significant differences. Spearman’s correlation analysis was performed by data of the Model group and EE group (n = 5).

