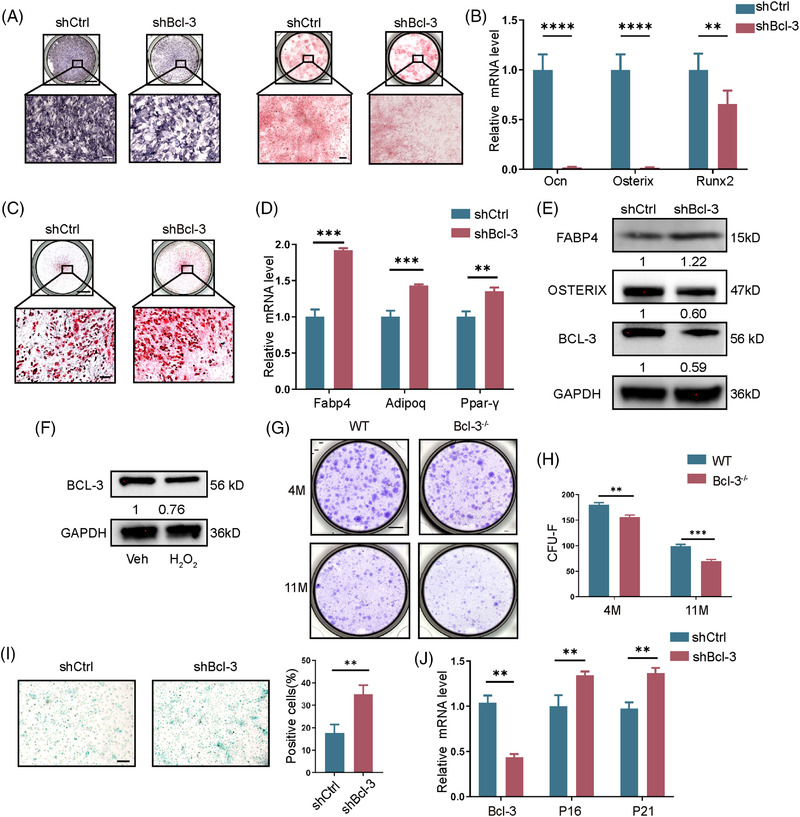
FIGURE 2.

Bcl‐3 regulates adipo‐osteogenic differentiation of bone marrow mesenchymal stem cells (BMSCs) in vitro and protects BMSCs from senescence. (A) Bcl‐3 was knockdown in BMSCs and cultured in differentiation medium. Cell differentiation was assessed by alkaline phosphatase (ALP) and Alizarin Red S (ARS) staining after14 days of osteogenic induction. Scale bar, 5 mm (above) and 200 μm (below). (B) The expression of osteogenesis markers (OCN, Osterix and Runx2) were analysed 14 days after osteogenic induction of Bcl‐3 knock‐out BMSCs. (N = 4 independent experiments). (C) Bcl‐3 was knockdown in BMSCs and cultured in differentiation medium. Cell differentiation was assessed by oil red staining after 21 days of adipogenic induction. Scale bar, 5 mm (above) and 200 μm (below). (D) The expression of adipogenic markers (Fabp4, Adipoq and PPARγ) was analysed 6 days after adipogenic induction of Bcl‐3 knock‐out BMSCs. (N = 4 independent experiments). (E) Western blot detection of GAPDH, Bcl‐3, Osterix and Fabp4 protein in BMSCs. The data are presented as the mean ± SD. (F) Western blot detection of GAPDH and Bcl‐3 protein levels in H2O2 treated BMSCs. (G,H) Representative images and quantification of CFU‐Fs formed by cells from Bcl‐3–/– and wild‐type (WT) mice. Scale bar, 0.5 mm. (N = 3 independent experiments). (I) SA‐β‐gal staining of Bcl‐3 knockdown BMSCs and quantitative analysis of SA‐β‐gal staining. Scale bar, 200 μm. (N =3 independent experiments). (J) Bcl‐3, P16 and P21 mRNA in Bcl‐3 knockdown BMSCs was assessed by qRT‐PCR. (N = 4 independent experiments). The data are presented as the mean ± SD. *P <.05; **P <.01; ***P < .005; ****P < .0001 vs. control group. Statistical analysis was performed using Student's t‐test (B, D, I and J) and two‐way ANOVA test (H). Primary antibodies: GAPDH, Abcam(ab181602); BCL‐3, Abcam(ab259832); FABP4, Abcam(ab92501); OSTERIX, Abcam(ab209484)
