
FIGURE 3.
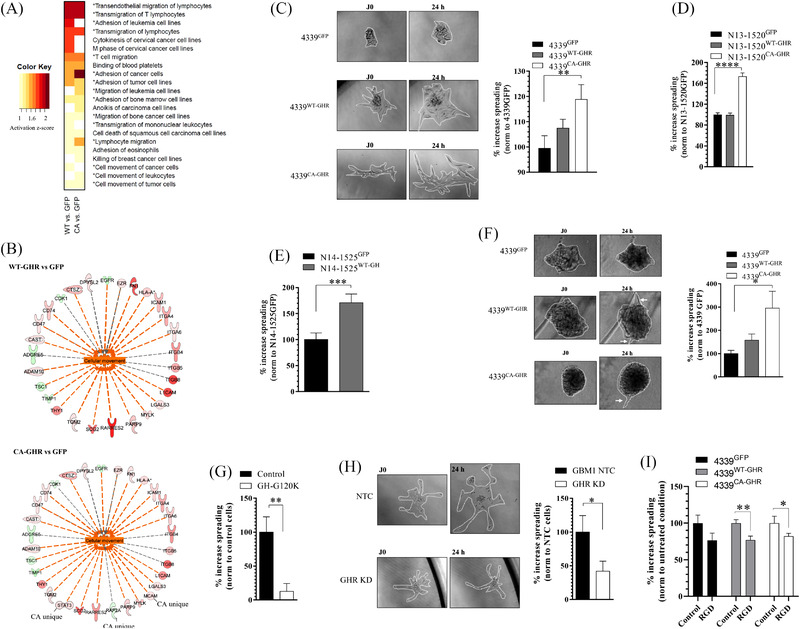
Activation of growth hormone receptor (GHR) signalling promotes cell migration and invasion in vitro. (A) Most activated biological functions in 4339WT‐GHR or 4339CA‐GHR versus 4339GFP (p ≤ .005) inferred from global proteomic analysis. Functions associated with cellular movement are marked with an asterix. (B) Network of molecules whose expression status (up/shades of red, or down/shades of green, p < .05) is predicted to promote activation of cell movement in 4339WT‐GHR versus 4339GFP or 4339CA‐GHR versus 4339GFP (activation z‐score +.9). (C–E) In vitro cell migration assays of patient‐derived cell lines (PDCLs) 4339WT‐GHR or 4339CA‐GHR versus 4339GFP with representative micrographs (C), N13‐1520WT‐GHR or N13‐1520CA‐GHR versus N13‐1520GFP (D) and N14‐1525WT‐GH versus N14‐1524GFP (E). Y‐axis represents the percentage of increase in sphere area over 24 h. (F) In vitro cell invasion assays of 4339WT‐GHR or 4339CA‐GHR versus 4339GFP and representative micrographs. Y‐axis represents the percentage of increase in sphere area over 24 h. (G) Effect of GHR signalling inhibition on in vitro migration of GBM1GHR high. Cells were exposed to 20‐μg/ml hGH‐G120K for 24 h. (H) Effect of GHR expression inhibition on in vitro migration of GBM1GHR high. CRISPR‐induced GHR knockdown (KD) is compared to non‐targeted control (NTC). (I) Effect of RGD peptide integrin antagonist on in vitro migration of 4339GFP, 4339WT‐GHR and 4339CA‐GHR. Cells were exposed to 1‐μg/ml RGD for 24 h. *p ≤ .05; **p ≤ .01; ***p ≤ .001; ****p ≤ .0001