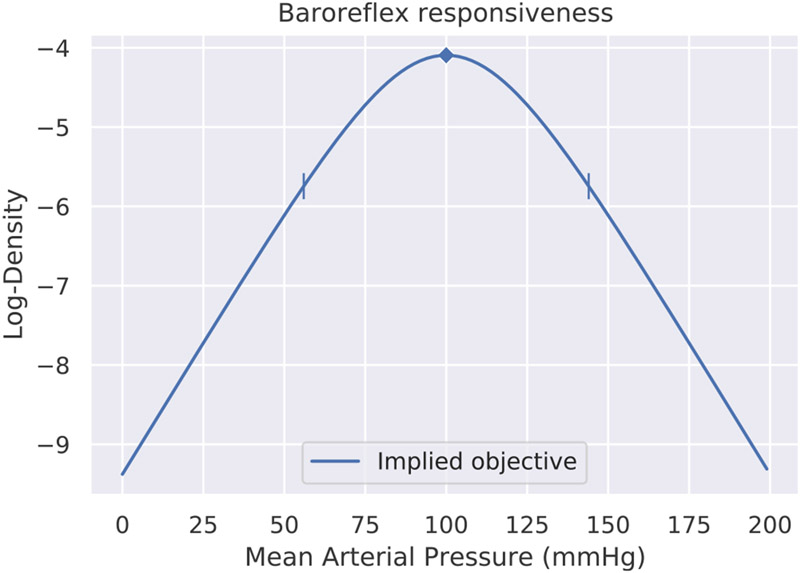
Fig. 8.
Logarithm of the probability density shown in Fig. 7, with the operating point shown as a diamond marker and tick-marks delineating threshold (left) and saturation (right) values. Probability density here corresponds to responsiveness to perturbation.

