. 2022 Apr 5;304(1):85–95. doi: 10.1148/radiol.211914

Figure 2:

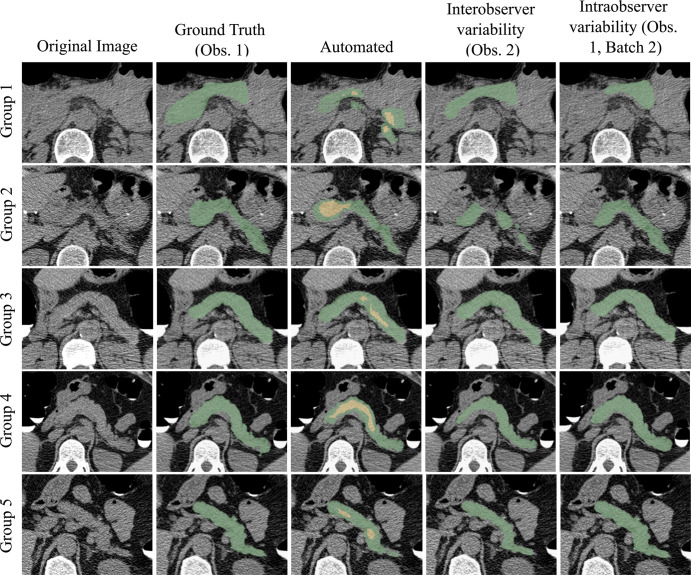
Pancreas segmentations in patients from each of the five visceral fat groups. Segmentation performance is better for patients with higher visceral fat (group 5 being the highest). Visceral fat percentages at the L1 level for the specific patients shown here were 9.81% in group 1, 13.72% in group 2, 20.19% in group 3, 27.88% in group 4, and 32.42% in group 5; Dice similarity coefficients were 0.36, 0.62, 0.78, 0.81, and 0.86, respectively. In the automated segmentation images, the green area indicates full segmentation and the yellow area indicates segmentation after erosion. Obs. = observer.

Pancreas segmentations in patients from each of the five visceral fat groups. Segmentation performance is better for patients with higher visceral fat (group 5 being the highest). Visceral fat percentages at the L1 level for the specific patients shown here were 9.81% in group 1, 13.72% in group 2, 20.19% in group 3, 27.88% in group 4, and 32.42% in group 5; Dice similarity coefficients were 0.36, 0.62, 0.78, 0.81, and 0.86, respectively. In the automated segmentation images, the green area indicates full segmentation and the yellow area indicates segmentation after erosion. Obs. = observer.