. 2022 Apr 5;304(1):85–95. doi: 10.1148/radiol.211914

Figure 3:

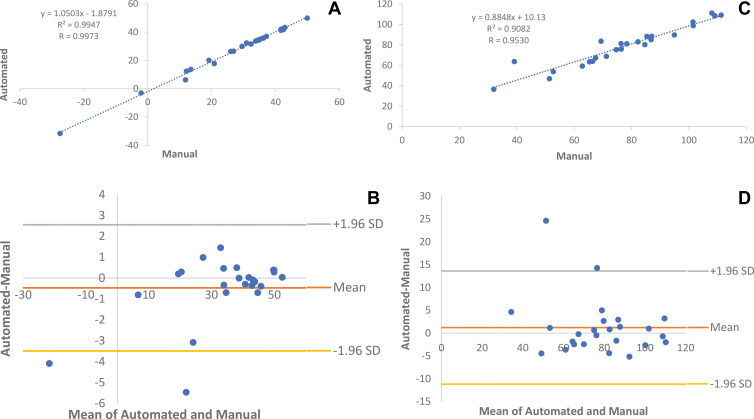
Automated and manual measurements for 25 randomly selected patients who underwent supine CT colonography. (A, B) Comparison of average CT attenuation in Hounsfield units with (A) linear regression and (B) Bland-Altman plots (r2 = 0.99, P < .001; Bland-Altman 95% limits of agreement: –3.49 to 2.55 HU). (C, D) Comparison of pancreas volume in milliliters with (C) linear regression and (D) Bland-Altman plots (r2 = 0.91, P < .001; Bland-Altman 95% limits of agreement: –11.18 to 13.60 mL).

Automated and manual measurements for 25 randomly selected patients who underwent supine CT colonography. (A, B) Comparison of average CT attenuation in Hounsfield units with (A) linear regression and (B) Bland-Altman plots (r2 = 0.99, P < .001; Bland-Altman 95% limits of agreement: –3.49 to 2.55 HU). (C, D) Comparison of pancreas volume in milliliters with (C) linear regression and (D) Bland-Altman plots (r2 = 0.91, P < .001; Bland-Altman 95% limits of agreement: –11.18 to 13.60 mL).