. 2022 Apr 5;304(1):85–95. doi: 10.1148/radiol.211914

Figure 4:

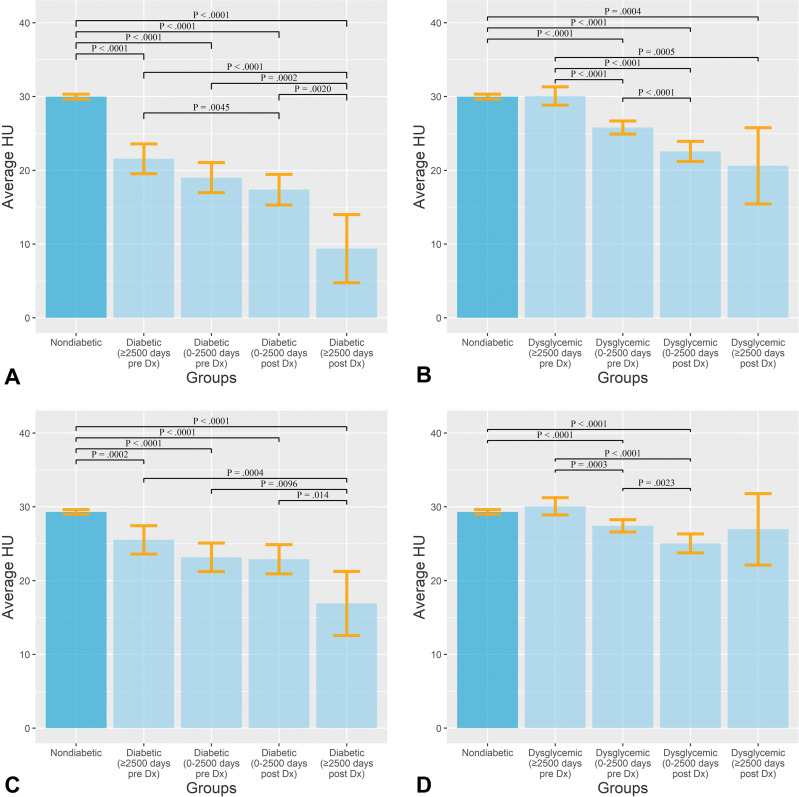
(A, B) Bar graphs show average Hounsfield units of pancreas in patients with (A) type 2 diabetes mellitus and (B) dysglycemia compared with participants without diabetes. (C, D) Bar graphs show average Hounsfield units of pancreas after controlling for body mass index in patients with (C) type 2 diabetes and (D) dysglycemia compared with participants without diabetes. Error bars show 95% CIs. Numbers in parentheses are the times between diagnosis (Dx) and imaging.

(A, B) Bar graphs show average Hounsfield units of pancreas in patients with (A) type 2 diabetes mellitus and (B) dysglycemia compared with participants without diabetes. (C, D) Bar graphs show average Hounsfield units of pancreas after controlling for body mass index in patients with (C) type 2 diabetes and (D) dysglycemia compared with participants without diabetes. Error bars show 95% CIs. Numbers in parentheses are the times between diagnosis (Dx) and imaging.