. 2022 Apr 12;304(1):228–237. doi: 10.1148/radiol.212426

Figure 2:

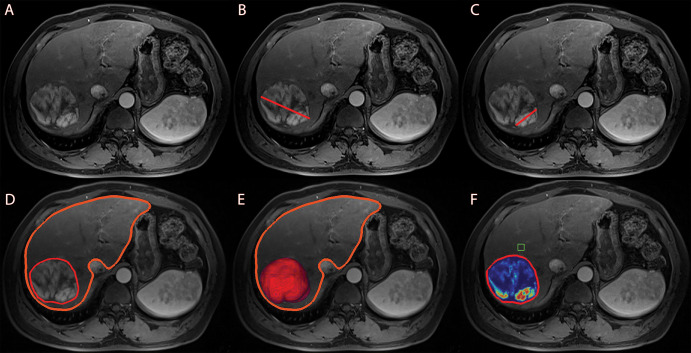
Anatomic and enhancement-based assessment methods on axial-view images. (A) Baseline arterial enhanced T1-weighted MRI scan, preprocedural for anatomic orientation. (B) One-dimensional measurement of the largest overall tumor diameter illustrated by a red line. (C) One-dimensional measurement of the largest enhancing tumor diameter illustrated by a red line. Enhancement was defined as hyperintense areas at the arterial phase that were not visible at the precontrast phase. (D) Semiautomated three-dimensional tumor and whole-liver segmentation to create a segmentation mask, which involves the entire lesion and liver. The fine red line outlines the tumor, and the thick orange line marks the liver contour. (E) Three-dimensional segmentation mask represents the total tumor volume in red at maximum intensity projection. (F) Automatically generated three-dimensional quantification of enhancing tumor volume based on image subtraction. A region of interest (green box) was placed on extratumoral liver parenchyma in the closest proximity to the tumor as a reference to calculate the relative enhancement values within the tumor. Color coding varied from red, representing maximum enhancement, to blue, representing no enhancement.

Anatomic and enhancement-based assessment methods on axial-view images. (A) Baseline arterial enhanced T1-weighted MRI scan, preprocedural for anatomic orientation. (B) One-dimensional measurement of the largest overall tumor diameter illustrated by a red line. (C) One-dimensional measurement of the largest enhancing tumor diameter illustrated by a red line. Enhancement was defined as hyperintense areas at the arterial phase that were not visible at the precontrast phase. (D) Semiautomated three-dimensional tumor and whole-liver segmentation to create a segmentation mask, which involves the entire lesion and liver. The fine red line outlines the tumor, and the thick orange line marks the liver contour. (E) Three-dimensional segmentation mask represents the total tumor volume in red at maximum intensity projection. (F) Automatically generated three-dimensional quantification of enhancing tumor volume based on image subtraction. A region of interest (green box) was placed on extratumoral liver parenchyma in the closest proximity to the tumor as a reference to calculate the relative enhancement values within the tumor. Color coding varied from red, representing maximum enhancement, to blue, representing no enhancement.