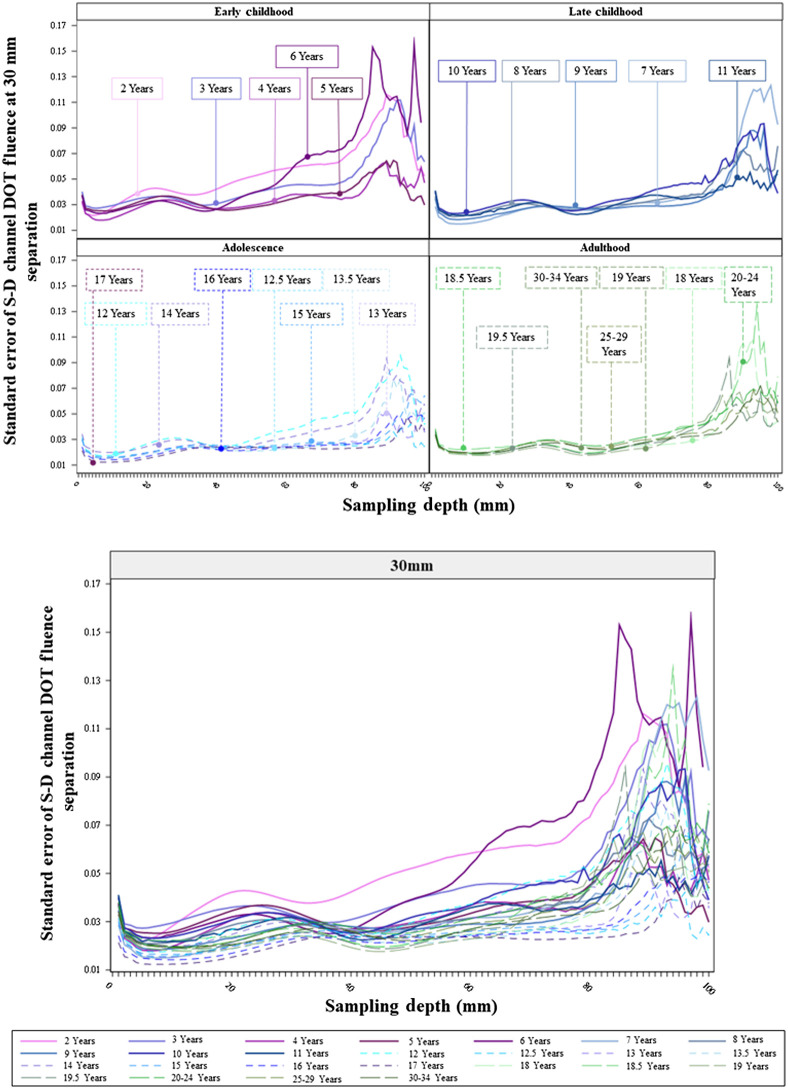
Fig. 10.
Standard error of the S-D channel DOT fluence sensitivity profile by individual age groups at 30 mm source–detector separation distance. The upper panel presents the variance as a function of sampling depth by age groups in age bins (as separate panels). The lower panel plots the variance by age groups in the same panel.

